

Comparing the Five Major Categories of Stocks
by Charles Rotblut | June 25, 2020
A quick note before I begin today’s commentary. The Internal Revenue Service updated its guidance regarding the CARES Act. I haven’t read the full notice yet, but I do know there are revisions affecting required minimum distributions (RMDs). RMDs taken this year—including in January—can now be rolled over to an IRA by August 31, 2020. In addition, rollovers of RMDs do not count against the one rollover per 12-month rule. On a separate note, we corrected the calculation of average one-year low and high returns discussed in last week’s commentary.
Over the long term, equities have realized the highest returns of the major asset classes. Stocks provide growth of wealth. The price for this growth is volatility, particularly downward price moves. (No one seems to mind volatility when it pushes prices upward.)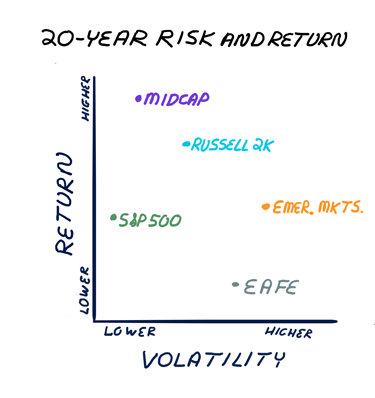
There are a few ways to manage this volatility. One is to adjust how much portfolio exposure you have to stocks. We’ll get to this in a couple of weeks when I introduce the next worksheets for The AAII Way. Another is to diversify among different categories of stocks.
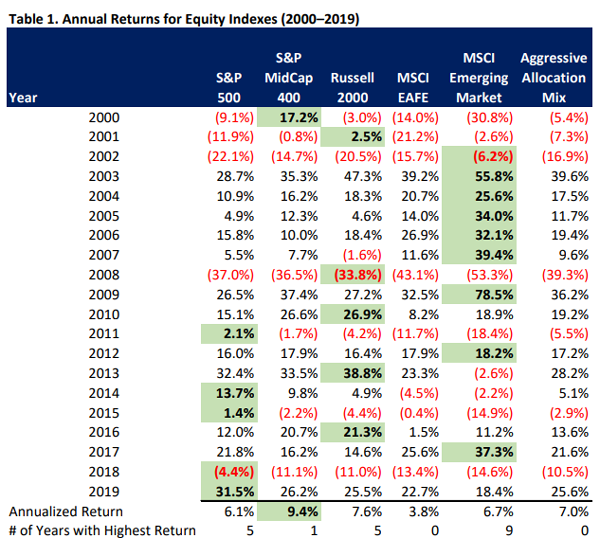
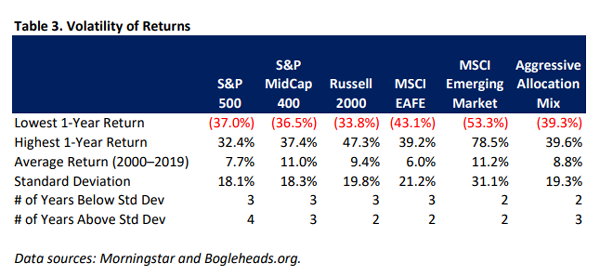
At the end of this week’s commentary, you’ll find tables with historical returns for five well-followed indexes: S&P 500 index, S&P MidCap 400 index, Russell 2000 index, MSCI EAFE index and MSCI Emerging Market index. We also show additional data to provide insights on volatility and how a blend of all five has worked. But first, a few insights and observations about each index.
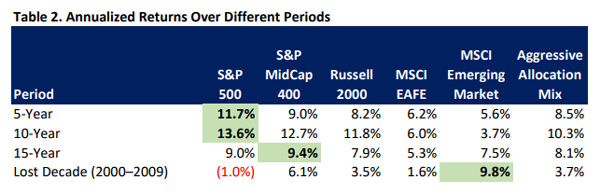
The S&P 500 is the most widely followed index. It tracks the performance of the largest U.S. companies. These companies are considered to be more fundamentally sound and many have international operations. They are also more likely to pay dividends than their smaller domestic brethren. The S&P 500’s strong relative performance over the last 10 years makes it easy to forget that the same index fell in value between 2000 and 2009 (aka, the lost decade).
The S&P MidCap 400 tracks mid-sized companies. Being neither large nor small, the stocks in this index are often overlooked in terms of allocation discussions. Yet, mid-cap stocks have outperformed both their large- and small-cap brethren over the last 20 years. This outperformance has been accompanied by volatility similar to the S&P 500. Notably, the S&P MidCap 400 has had the highest calendar-year return just one time over the past 20 years, in 2000. This fact demonstrates how diversification can increase your odds of being allocated to the right type of stocks at the right time.
The Russell 2000 targets small-cap companies, specifically those whose market capitalization ranks them between 1,000 and 3,000 in terms of size based on the criteria used by FTSE Russell. Because these companies are smaller, they are less likely to pay dividends, more likely to be domestically focused and are more volatile. Since analysts pay less attention to them and large institutional investors can’t allocate much money to them, small-cap stocks are more likely to be mispriced and thus have higher upside potential. However, the long-term outperformance of these stocks (aka, the small-cap premium) has not been realized over the last 10 years.
The MSCI EAFE is the most widely followed international index. It tracks large- and mid-cap stocks in more than 20 developed market countries located in Europe, Australia, Asia and the Far East. As of May 2020, Japan, the U.K., France and Switzerland accounted for 60% of the index’s country weightings. Foreign markets often don’t move in lockstep with the U.S. markets, thereby providing a diversification benefit. (Correlations tend to rise during turbulent market conditions, however, making these less of a diversifier relative to other asset classes, like bonds.) Currency fluctuations will also affect the returns realized by U.S. investors. Unfortunately, the diversification benefits have been offset by lackluster returns over the last 20 years.
The MSCI Emerging Markets tracks companies from 26 different countries across the globe. China has a major influence on the index’s returns with a 33% country weighting. This is more than double the weighting of the second-most represented country, South Korea. The argument for emerging markets is their economic growth potential. Still young economies, volatile currencies and, often, political issues (unstable governments, rogue leaders, corruption, etc.) are risks. As such, these stocks are not for the faint of heart as can be seen by their high levels of volatility. While emerging market stocks enjoyed a high level of relative performance during 2000–2009, they were also the worst-performing category over the past 10 years.
The aggressive allocation mix shown in the tables below reflects the stock portion of our aggressive allocation model (which will be discussed in a future Investor Update). It calls splitting the equity allocation into two-thirds domestic stocks and one-third international stocks. All indexes are weighted evenly except for emerging markets, which gets a half weighting (approximately 11% of the equity portion instead of 22%).
While our aggressive allocation mix of equities has underperformed the S&P 500 and the S&P MidCap 400 indexes over the last 20 years, the argument for diversifying it is that we don’t know which of the five indexes will perform best over the next 20 years. If we had a working crystal ball, it would be easy to pick one index or category of stocks. We don’t, and neither does anybody else. Spreading investment dollars over different types of stocks increases the odds of being allocated to the right category at the right time.
Data on all five indexes and our aggressive allocation mix of equities is shown below. The first two tables provide return information. The green shaded cells highlight the best-performing index for a given period. The last table provides data on how volatile each index has been. Next week, I’ll provide similar data on bonds.

-
Market Barometers: A Look at Stock Indexes and How They Work – The returns of the indexes mentioned above are influenced by the returns of their largest companies. Not all indexes weight by market capitalization, however.
-
The Rationale for Investing in Emerging Markets – Both past economic growth and the potential for future economic growth are why proponents think investors should allocate to emerging markets as this 2012 AAII Journal article explains.
The percentage of individual investors describing their short-term outlook for stocks as “bullish” is at its lowest level in six weeks. At the same time, the latest AAII Sentiment Survey shows pessimism at a six-week high.
Bullish sentiment, expectations that stock prices will rise over the next six months, declined 0.2 percentage points to 24.1%. Optimism was last lower on May 13, 2020 (23.3%). Bullish sentiment is below its historical average of 38.0% for the 16th consecutive week and the 21st week this year.
Neutral sentiment, expectations that stock prices will stay essentially unchanged over the next six months, pulled back by 0.9 percentage points to 27.0%. Neutral sentiment remains below its historical average of 31.5% for the 19th consecutive week and the 23rd time in 24 weeks.
Bearish sentiment, expectations that stock prices will fall over the next six months, rose 1.1 percentage points to 48.9%. Pessimism was last higher on May 13, 2020 (50.6%). Bearish sentiment is above its historical average of 30.5% for the 18th consecutive week and the 20th time this year.
Optimism remains at an unusually low level (more than one standard deviation below its historical average). Pessimism is at an unusually high level. Historically, both have generally been followed by above-average and above-median returns for the S&P 500 index, though the link is stronger for unusually low bullish sentiment than it is for unusually high bearish sentiment.
The current level of pessimism reflects concerns about the coronavirus pandemic and the economy. However, some AAII members have been encouraged by the rebound in the stock market from its March lows. Other factors influencing AAII members’ sentiment include the economy, corporate earnings, the November U.S. presidential election and interest rates.
In this week’s special question, we asked AAII members how the current headlines and statistics about the coronavirus pandemic are impacting their sentiment toward the stock market. More than one-quarter (28%) of respondents say coronavirus-related news has little to no impact on their sentiment toward the stock market. This compares to 27% of respondents who say that coronavirus-related news makes them more cautious, given the uncertainty and stock market volatility.
Other respondents express long-term optimism about the stock market (15%), a belief about the virus having a moderate to large impact (8%) and worries about the stock market falling (6%).Additionally, 16% of respondents fell into the ‘other’ category which named the election, interest rates and federal efforts to boost the economy as more influential factors on their sentiment toward the stock market.
Here is a sampling of the responses:
- “There is too much overreaction to all of this coronavirus news. I’m in stock for the long haul and I don’t let the media impact how I invest.”
- “Until there is a vaccine, the chances of another sizable outbreak in the fall is non-trivial. The corporate earnings outlook is uncertain at best. I cannot find a rational explanation for the current levels of the markets other than pure speculation and hope.”
- “I feel that the direction that the stock market takes on a daily basis is largely driven by the news of the day, therefore I expect it to keep fluctuating fairly moderately until a vaccine is produced and becomes readily available.”
- “Would expect a second wave for the coronavirus to reset the unusual present market ebullience, resulting in a market decline that more closely reflects expected earnings for 2020.”

Bullish: 24.1%, down 0.2 points
Neutral: 27.0%, down 0.9 points
Bearish: 48.9%, up 1.1 points
Bullish: 38.5%
Neutral: 31.0%
Bearish: 30.5%
June 18, 2020 How Much Could You Gain or Lose in One Year?
June 11, 2020 Responding to Member Feedback About Assessing Risk Tolerance
June 4, 2020 Two Key Factors Influencing Your Risk Tolerance
May 28, 2020 Why Is Money Important to You?

Discussion
No comments have been added yet. Add your thoughts to the discussion!
You need to log in as a registered AAII user before commenting.
Create an account