

Responding to Member Feedback About Assessing Risk Tolerance
by Charles Rotblut | June 11, 2020
Last week, we introduced a worksheet for assessing your risk tolerance as part of The AAII Way project we’re working on. The worksheet included a grid. Timing risk ran horizontally across the grid, while contributions/withdrawals relative to wealth ran vertically. The logic behind the grid was that risk is a function of when you will need the money and how much you will need relative to your wealth.
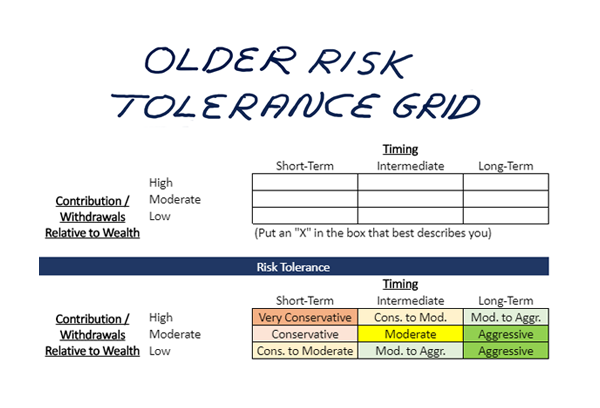
Upon publishing the grid, we asked for feedback. A few members pointed out the challenge of having to select just one box for retirement. Jim I., for instance, wrote, “In the case of continual drawdowns I’d want to put X’s across the entire bottom row.”
It’s an interesting point to bring up.
It’s also a challenging one from the standpoint of creating a grid an investor can use to say, “I have a moderate level of risk tolerance.” On the one hand, retirement requires withdrawing from the portfolio to cover living expenses. This implies a more conservative allocation. On the other hand, it requires additional portfolio growth as someone in their late 60s or early 70s could live for an additional two or possibly even three or more decades. This implies a more aggressive allocation.
New parents face a similar challenge when determining how to allocate their child’s college savings. A time horizon, of say 15–18 years, calls for a more aggressive allocation stance in terms of saving. Once the child is close to starting college, the spending period is short (four years if the child graduates on time and post-graduate studies are excluded from the plan). This implies switching to a conservative allocation as the goal approaches.
To address this challenge—and other feedback given to us by AAII members—we’ve modified the grid. It now plots timing risk against financial/psychological tolerance.
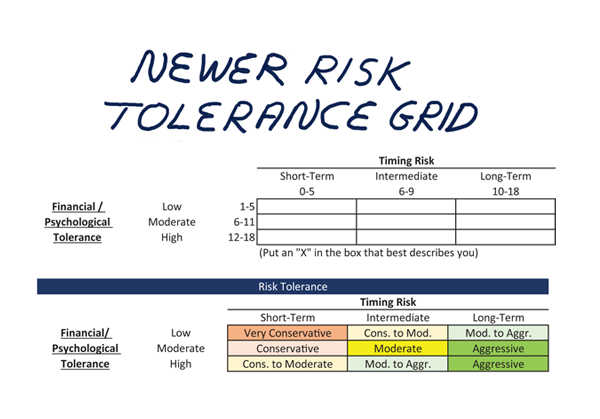
We’ve also added a questionnaire to help you better assess where on the grid you fit. I’m going to walk you through three of the questions to illustrate what we’ve done.
I’ll use the hypothetical couple Bob and Jane. They are in their 60s and recently retired. Their primary goal is funding their retirement. They are fortunate to be affluent and have both pension and Social Security benefits.
Timing question #1: How many years away is the goal?
Answer options:
Now or in the short-term future (five years or less)—Score: 1
Intermediate—Five to 10 years—Score: 3
Long-term—More than 10 years—Score: 6
Since they have recently retired, they choose the first answer, which is “now.” This gives them a score of 1, indicating short-term timing.
Timing question #2: Over what time period do you anticipate spending money on the goal?
Answer options:
Short-term (five years or less)—Score: 1
Intermediate—Five to 10 years—Score: 3
Long-term—More than 10 years—Score: 6
Assuming they are in good health, they could be looking at the possibility of their retirement spanning three decades or more. So, they choose the third answer, which is “long-term” and has a score of 6.
Timing question #3: Relative to your wealth, how large of a withdrawal will your goal require over a period of five years or less?
Answer options:
High—More than 25% of wealth—Score: 1
Moderate—10% to 25% of wealth—Score: 3
Low—Less than 10% of wealth—Score: 6
Whereas question #2 focuses on when the money will be spent, question #3 considers the proportionate amount spent over a short period. Bob and Jane choose the third answer “low” because they will be limiting the size of their portfolio withdrawals. This answer has a score of 6. (Note: Even if they used an inflation-adjusted withdrawal rate of 4%, growth in the overall portfolio should be enough to keep the impact on wealth proportionately low.)
The combination of possible points ranges from 3 (short-term for questions #1 and #2 and high for question #3) to 18 (long-term and low, respectively). We’d put Bob and Jane at the bottom range of scores for long-term timing risk since portfolio growth will continue to be a priority for them.
Now, let’s assume a younger couple, Frank and Sue, have a goal of paying for their child’s college education. If this child is still young, say three years old, the answers to questions #1 and #2 would be reversed. They’d have a long time horizon (15 years) until the goal of paying for college would be reached, but a short time horizon for spending the money they’ve set aside (four years). In this case, the combined scores for the first two questions is still the same, but the timing is reversed.
How Frank and Sue answer question #3 could differ from Bob and Jane. We’ll assume Frank and Sue will spend a moderate level of their wealth paying for college, given their younger age and comparatively fewer years working. This would lower their total timing risk score to 10, which is still considered long-term.
If their health were in question, they’d opt for a shorter spending time horizon. Alternatively, if Frank and Sue’s child was about to start high school, then their investing time horizon would be shorter. Either way, their risk tolerance would be more conservative than the options shown because they’d have less time to recover from any market downturn.
In the revised risk tolerance worksheet, we’ve included an expanded version of this questionnaire to prompt you to consider not only your timing risk, but also your financial and psychological tolerance. The changes reflect the feedback we’ve received from members. Try it out and let us know if it works better for you.
We’ll address how answers to the risk worksheet translate into portfolio allocations on the next new worksheet.
Try out The AAII Way worksheets we’ve created so far and give us your feedback in the comments section for each. We want them to be useful to you.
1. Identifying and Prioritizing Your Financial Goals Worksheet
2. Our Revised Risk Tolerance Worksheet – New!

-
The Sequence in Which Returns Occur Affects Your Wealth – The timing of when money will be needed matters from a risk standpoint because an ill-timed period of bad returns can cause you to miss your goals.
-
Bear Market Strategies: Watch the Spending, Hold the Stocks – This 2003 study from T. Rowe Price found that retirees with long time horizons should be willing to tolerate higher levels of volatility in order to realize higher returns.
The percentage of individual investors describing their outlook for stocks as “neutral” is at its highest level since February. The latest AAII Sentiment Survey also shows small declines in optimism and pessimism.
Bullish sentiment, expectations that stock prices will rise over the next six months, declined by a mere 0.3 percentage points to 34.3%. Optimism remains below its historical average of 38.0% for the 14th consecutive week and the 19th week this year.
Neutral sentiment, expectations that stock prices will stay essentially unchanged over the next six months, rose 1.1 percentage points to 27.7%. Neutral sentiment was last higher on February 26, 2020 (30.4%). Even with the increase, neutral sentiment is below its historical average of 31.5% for the 17th consecutive week and the 21st time in 22 weeks.
Bearish sentiment, expectations that stock prices will fall over the next six months, fell 0.8 percentage points to 38.1%. Pessimism was last lower on February 19, 2020 (28.7%). Bearish sentiment is above its historical average of 30.5% for the 16th consecutive week.
All three readings are within their typical historical ranges.
The survey period runs from Thursday morning through Wednesday night. Reminders to take the survey are sent to a rotating group of AAII members on Mondays.
The current level of pessimism reflects the coronavirus pandemic and concerns about the economy. However, some AAII members have been encouraged by the rebound in the stock market from its March lows. Other factors influencing AAII members’ sentiment include the economy, corporate earnings, the November U.S. presidential election and interest rates.
This week’s special question asked AAII members to share their thoughts about the level of optimism being reflected in the stock market. More than two out of five respondents (41%) think there is currently too much optimism. Respondents in this group think the rise in stock prices does not reflect current conditions and/or ignores the possibility of the pandemic worsening again. An additional 22% of respondents think stock prices are too high given the ongoing weak economic conditions.
Nearly 14% view the rally as being justified. They credit fiscal and monetary stimulus, the reopening of businesses and progress on finding a vaccine. About 8% think the upward run in stock prices is attributable to the Federal Reserve’s actions.
Here is a sampling of the responses:
- “I think the financial markets are getting ahead of the reality of the recovery right now.”
- “I think the optimism is too high and stock prices have gotten too far ahead of fundamental valuations.”
- “The stock market will continue to rise due to all the money printing by the Fed.”
- “It is justified due to the sharp restart of the economy after the coronavirus and the huge monetary and budget stimulus.”
- “I’m perplexed. I have no idea during these times how to guess the direction of the market.”

Bullish: 34.3%, down 0.3 points
Neutral: 27.7%, up 1.1 points
Bearish: 38.1%, down 0.8 points
Bullish: 38.5%
Neutral: 31.0%
Bearish: 30.5%
June 4, 2020 Two Key Factors Influencing Your Risk Tolerance
May 28, 2020 Why Is Money Important to You?
May 21, 2020 A Five-Step Process for Building and Maintaining Wealth
May 14, 2020 We’re Going to Help You Create an Investing Plan

Discussion
No comments have been added yet. Add your thoughts to the discussion!
You need to log in as a registered AAII user before commenting.
Create an account