

Two Key Factors Influencing Your Risk Tolerance
by Charles Rotblut | June 04, 2020
A key cornerstone of any investment plan is understanding one’s tolerance for risk. A strategy with high returns is never optimal for an investor who lacks the ability to stick with it. To help you identify your tolerance for risk, we’ve developed a new worksheet as part of The AAII Way. Before you view it, we’d like to explain the logic behind it.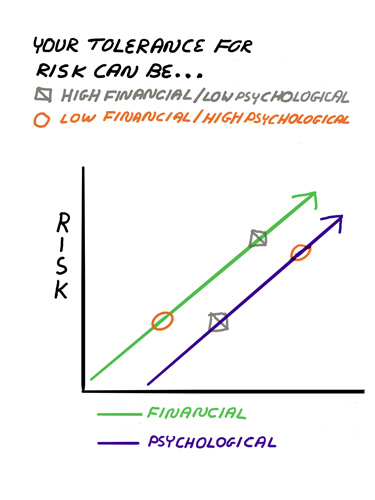
Risk in investing is commonly described in terms of volatility. The more a given investment has fluctuated in value or is expected to, the riskier it is perceived. Risk questionnaires commonly ask investors how they would react to an X% drop in the market or their portfolio.
AAII founder James Cloonan believes a different definition should be used. “Real risk is the likelihood of not having the assets saved when you need them. Phantom risk is volatility that has little impact on the long-term investor. In fact, the long-term investor should love short-term volatility because the fear of it by most investors is what leads to the 10% annual returns that cannot be justified by risk alone,” Cloonan explained in 2017.
For those who are stoic in the face of market drops, this makes absolute sense. The short-term swings in asset prices are simply the price an investor pays to realize higher returns. Investors like Warren Buffet understand this. Not everyone has the psychological ability to withstand market volatility; many don’t. If you’re among this latter group, your risk profile is more conservative than a similar investor who isn’t bothered by the price swings. Psychology is only one part of an investor’s risk profile though.
Another key aspect is the timing of when you will need to spend cash from savings and how much you will need to spend relative to your total wealth. Put another way, will you have the money to spend at the time you will need it? Allocating money to stocks that you will need to spend in two years is discouraged because of the short-term fluctuations in the market. At the opposite end, allocating money to stocks that is not needed for periods of a decade or more is encouraged because the high long-term returns will more than compensate you for the volatility.
A couple of examples might add an additional layer of clarity to this discussion.
I’ll start with a hypothetical recently retired couple Bob and Jane. They have $1.5 million in savings and are both age 66. Their primary goal is paying for retirement. The couple is fortunate to have pension and Social Security benefits that provide $100,000 in income, allowing them to accept a higher level of risk than many other retirees. The guaranteed sources of income are used to cover their expected expenses.
Because of this, they can focus on their second goal, which is helping with the education expenses of their eldest grandchild. The date for starting college is in eight years, which is “intermediate” in terms of timing. Because Bob and Jane are affluent, the dollar amounts spent on their grandchild will be low relative to their overall wealth (assuming they aren’t picking up the full tab). These factors suggest a moderate-to-aggressive risk tolerance. They can afford to tolerate market swings to realize higher returns but still have to consider the timing of when the money will be spent. Whether they should opt for a moderate or aggressive allocation will depend on their psychological ability to cope with market volatility.
Now, let’s consider Elizabeth. She is a millennial in her mid-20s with college loans, credit card debt and a little in savings. Her first goal is to build up emergency savings in order to avoid relying on credit cards to pay for unexpected expenses in the future.
While someone Liz’s age would normally be viewed as having a high tolerance for risk, the risk profile for her first goal is very conservative. She lacks wealth since she’s just starting out in her career. The timing of when Liz will need the money is potentially short since it is being designated for emergencies (e.g., if her computer breaks). The money she is setting aside for savings should go into an interest-bearing bank account, not the stock market.
If Liz has the financial flexibility to do so, she should also start saving for retirement given her young age—especially if her employer matches contributions to the 401(k) plan. In this case, Liz would fill out the risk profile worksheet more than once. Using the two examples provided here, she’d fill out the worksheet once for her emergency savings and a second time for her retirement savings. The second worksheet would reflect a moderate-to-aggressive risk profile given Liz’s long-term horizon but limited wealth.
Try out The AAII Way worksheets we’ve created so far and give us your feedback in the comments section for each. We want them to be useful to you.
1. Identifying and Prioritizing Your Financial Goals Worksheet

-
Why Gender Tolerances Toward Risk May Vary – Uncertainty about income may lead women to be more risk-averse than men.
-
Allocating to Manage Risk: A Case Study – We analyzed a different hypothetical retired couple’s portfolio, along with a strategy to reduce the damage of turbulent market conditions.
The percentage of individual investors describing their short-term outlook for the stock market as “bearish” is at its lowest level in nearly four months. The latest AAII Sentiment Survey also shows increases in bullish and neutral sentiment.
Bullish sentiment, expectations that stock prices will rise over the next six months, increased 1.5 percentage points to 34.6%. This is a seven-week high. Nonetheless, optimism remains below its historical average of 38.0% for the 13th consecutive week and the 18th week this year.
Neutral sentiment, expectations that stock prices will stay essentially unchanged over the next six months, rebounded by 1.8 percentage points to 26.6%. Neutral sentiment is below its historical average of 31.5% for the 16th consecutive week and the 20th time in 21 weeks.
Bearish sentiment, expectations that stock prices will fall over the next six months, fell 3.3 percentage points to 38.9%. Pessimism was last lower on February 19, 2020 (28.7%). Even with the decrease, bearish sentiment is above its historical average of 30.5% for the 15th consecutive week.
Pessimism is back within its typical range for the first time since early March. Both bullish and neutral sentiment continue to be within their typical ranges.
The current level of pessimism reflects the coronavirus pandemic and concerns about the economy. However, some AAII members have been encouraged by the rebound in the stock market from its March lows. Other factors influencing AAII members’ sentiment include the economy, corporate earnings, the November U.S. presidential election and interest rates.
In this week’s special question, we asked AAII members which factors are most influencing their six-month outlook for stocks. Two out of five (40%) respondents say that the country’s ability to manage the coronavirus pandemic and reopen businesses in the near future are the biggest influential factors. This compares to 30% of respondents who say quarterly economic data and the unemployment rate are the most influential factors. Other factors include earnings reports (named by 12% of respondents) and the upcoming election (10%). Additionally, 9% of respondents fall into the ‘other’ category, naming interest rates, political issues and Federal Reserve efforts to boost the economy.
Here is a sampling of the responses:
- “Unemployment cannot go away quickly. Major financial delinquencies have not yet been recognized. The stock market is looking long-range assuming that everything goes back to normal, but the above issues will not be as before.”
- “We are looking at businesses opening back up and there is pent up demand to socialize. I believe there is a lot of cash on the sidelines and the stock market is the main place to invest.”
- “High unemployment, many small business failures. I believe that we will retest the lows of this past March. There will be a great deal more pain before we begin to recover in the second half of 2021.”
- “The pressures to restart the economy are growing and the old standard approach of looking at past data is nearly useless, so I think a look-ahead mentality will prevail. I don’t think we’ll make new market highs ... just higher than we are now.”

Bullish: 34.6%, up 1.5 points
Neutral: 26.6%, up 1.8 points
Bearish: 38.9%, down 3.3 points
Bullish: 38.5%
Neutral: 31.0%
Bearish: 30.5%
AAII Asset Allocation Survey
Exposure to equities among individual investors continued to rebound last month, according to the May AAII Asset Allocation Survey. Fixed-income allocations remained above average, while cash exposure declined.
Stock and stock fund allocations rebounded by 3.3 percentage points to 60.8%. Even with the rebound, equity allocations remain below their historical average of 61.0% for the third consecutive month.
Bond and bond fund allocations declined by 0.3 percentage points to 19.2%. Fixed-income allocations are above their historical average of 16.0% for the 15th consecutive month and the 16th time in 17 months.
Cash allocations fell 3.0 percentage points to 20.0%. The historical average is 23.0%.
Equity allocations have risen as the stock market continued to rally from its March lows. Sentiment about the short-term direction of the stock market remained low throughout May, however, as is evident by the readings in our weekly Sentiment Survey. Fixed-income allocations are above 19% for the third time in four months.
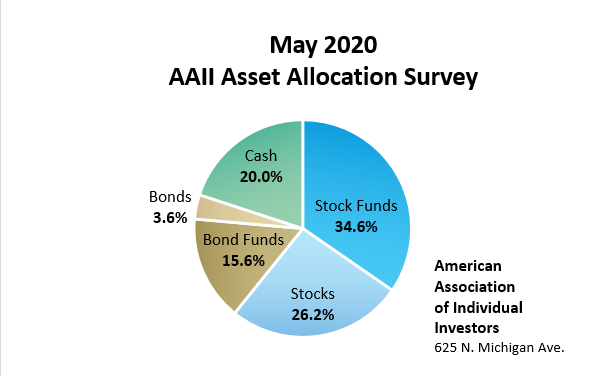
May AAII Asset Allocation Survey results:
- Stocks and stock funds: 60.8% up 3.3 percentage points
- Bonds and bond funds: 19.2%, down 0.3 percentage points
- Cash: 20.0%, down 3.0 percentage points
May AAII Asset Allocation Survey details:
- Stocks: 26.2%, up 1.3 percentage points
- Stock funds: 34.6%, up 2.0 percentage points
- Bonds: 3.6%, down 0.3 percentage points
- Bond funds: 15.6%, up 0.1 percentage points
Historical Averages:
- Stocks/Stock Funds: 61.0%
- Bonds/Bond Funds: 16.0%
- Cash: 23.0%
The numbers are rounded and may not add up to 100%.
The AAII Asset Allocation Survey has been conducted monthly since November 1987 and asks AAII members what percentage of their portfolios are allocated to stocks, stock funds, bonds, bond funds and cash. The survey and its results are available online at: www.aaii.com/investor-surveys.
- Stocks and Stock Funds: 60.8%, up 3.2 percentage points
- Bonds and Bond Funds: 19.2%, down 0.2 percentage points
- Cash: 20.0%, down 3.0 percentage points
- Stocks: 26.2%, up 1.3 percentage points
- Stocks Funds: 34.6%, up 2.0 percentage points
- Bonds: 3.6%, down 0.3 percentage points
- Bond Funds: 15.6%, up 0.1 percentage points
- Stocks/Stock Funds: 62.0%
- Bonds/Bond Funds: 16.0%
- Cash: 22.0%
Take the Asset Allocation Survey.
May 28, 2020 Why Is Money Important to You?
May 21, 2020 A Five-Step Process for Building and Maintaining Wealth
May 14, 2020 We’re Going to Help You Create an Investing Plan
May 7, 2020 Small-Cap Stocks Are Really Cheap, Relatively Speaking

Discussion
GurBachan S Virk from California posted over 6 years ago:
The chart in the article will more sense if you indicate the variable of the horizontal axis so that one can understand the relationship beteween RISK and whatever is on the horizontal axis.
Barry C Johnson from TX posted over 6 years ago:
This month’s special question asked AAII members how the prevailing economic data has affected their asset allocation decisions. Two out five respondents (40%) state that they have followed a more conservative allocation strategy as a result of the recent economic data. A majority within this group also state that they are allocating more to cash and bond holdings. This compares to 26% of respondents who say their allocation strategy has not changed as a result of any data. Many within this group state that they follow a ST investing strategy and prefer not to be swayed by market fluctuations. Other responses include those who state that they are rebalancing their holdings more often and looking for bargain investment opportunities (21%) and those who say that economic data has led them to allocate a greater amount to dividend-focused stocks (14%). Here is a sampling of the responses: ? “I cashed out some winners to prepare for a protracted downturn and to take advantage of investment opportunities during the downturn.” ? “I have been making some purchases to take advantage of bargains, but going forward, I’m playing defense and will shift my allocation back to a more conservative mix.” ? “I moved a higher-than-usual percentage to cash and bonds; especially without performance of bonds for last couple of years, it has paid off.” ? “The prevailing economic data is not affecting my asset allocation decisions. Opportunistic purchasing of discounted stocks is my current strategy.” ? “We are looking for good value equities with a ST investing horizon. In particular, consistent dividend payers selling at a reasonable valuation.” May AAII Asset Allocation Survey results: ? Stocks and stock funds: 60.8% up 3.3 percentage points ? Bonds and bond funds: 19.2%, down 0.3 percentage points ? Cash: 20.0%, down 3.0 percentage points May AAII Asset Allocation Details: ? Stocks: 26.2%, up 1.3 percentage points ? Stock funds: 34.6%, up 2.0 percentage points ? Bonds: 3.6%, down 0.3 percentage points ? Bond funds: 15.6%, up 0.1 percentage points Take the Asset Allocation Survey. ? After I read this article, I checked my downloads of articles from all the sources I use to gather investment advice. I was astonished by the LACK of articles on risk. This article is very timely. I have always been very unimpressed with the highly simplified "risk profile' surveys EVERY investment advisor asks prospective clients to complete prior to preparing their "investment plan" and allocation strategies. They are all alike. They give prospective investors 5 choices stated in 10-15% ranges approximating based on some unknown distribution of standard deviations of "risk levels" based on historical variations of annual returns. The descriptors for the ranges are standardized as another range from “Very Conservative" to "Very aggressive." Sound familiar? The purpose of a "risk assessment" is not to help you understand your behavioral disposition for risk tolerance or to help you make better investment decisions. The purpose is to put you in a category that allows them to allocate you to their business model. It sets the background for a superficial discussion with someone completely untrained in psychological and behavioral dynamics of "risk tolerance" that locks you into a homogenized off-the-shelf "investment strategy" usually based on providing you with an assortment of ETFs (you could easily find by yourself) that someone pays them to recommend and .., that they have you pay a third party to make all the underlying investment decisions. This is a simple trick in misdirection. If you hit your goals, they take credit and take their fees. If you miss your goals, they blame poor risk tolerance assessment and ask you to redo the survey (or some other factors). Either way, they get the same fees. No wonder, as the old saw goes, they have the yachts and you don't. I appreciate AAII taking the lead to educate investors on the inadequacies of the current state of "risk assessment" strategies. There is an evolving body of knowledge on what behavioral economists call "discounting." It gets complex in a hurry (as it should for a highly personalized and dynamic personality characteristic). A top-level summary of their findings is PEOPLE ARE VERY POOR JUDGES OF RISK (scales, time periods, degrees, etc.) and THEY CHANGE THEIR PERCEPTIONS OF RISK RAPIDLY OVER TIME ... and FROM TIME TO TIME.
Barry C Johnson from TX posted over 6 years ago:
REPOSTED DUE TO COPYING ERROR and no EDIT BUTTON After I read this article, I checked my downloads of articles from all the sources I use to gather investment advice. I was astonished by the LACK of articles on risk. This article is very timely. I have always been very unimpressed with the highly simplified "risk profile' surveys EVERY investment advisor asks prospective clients to complete prior to preparing their "investment plan" and allocation strategies. They are all alike. They give prospective investors 5 choices stated in 10-15% ranges approximating based on some unknown distribution of standard deviations of "risk levels" based on historical variations of annual returns. The descriptors for the ranges are standardized as another range from “Very Conservative" to "Very aggressive." Sound familiar? The purpose of a "risk assessment" is not to help you understand your behavioral disposition for risk tolerance or to help you make better investment decisions. The purpose is to put you in a category that allows them to allocate you to their business model. It sets the background for a superficial discussion with someone completely untrained in psychological and behavioral dynamics of "risk tolerance" that locks you into a homogenized off-the-shelf "investment strategy" usually based on providing you with an assortment of ETFs (you could easily find by yourself) that someone pays them to recommend and .., that they have you pay a third party to make all the underlying investment decisions. This is a simple trick in misdirection. If you hit your goals, they take credit and take their fees. If you miss your goals, they blame poor risk tolerance assessment and ask you to redo the survey (or some other factors). Either way, they get the same fees. No wonder, as the old saw goes, they have the yachts and you don't. I appreciate AAII taking the lead to educate investors on the inadequacies of the current state of "risk assessment" strategies. There is an evolving body of knowledge on what behavioral economists call "discounting." It gets complex in a hurry (as it should for a highly personalized and dynamic personality characteristic). A top level summary of their findings is PEOPLE ARE VERY POOR JUDGES OF RISK (scales, time periods, degrees, etc.) and THEY CHANGE THEIR PERCEPTIONS OF RISK RAPIDLY OVER TIME and FROM TIME TO TIME.
Jim Isaacson from UT posted over 6 years ago:
This seems appropriate for discrete events, such as college tuition, but maybe less so for a decision as to what you can afford to draw down (such as retirement or travel) somewhat continually over time. In the case of continual draw downs I'd want to put X's across the entire bottom row. In the second example I could see Liz going fully aggressive, noting that she has a parallel goal to fund emergency savings. Wouldn't that buffer eliminate the risk or cautiousness around retirement savings? If the time horizon is long, why wouldn't that entire column be "aggressive"?
You need to log in as a registered AAII user before commenting.
Create an account