

Small-Cap Stocks Are Really Cheap, Relatively Speaking
by Charles Rotblut | May 07, 2020
In this month’s AAII Journal, AAII president John Bajkowski discusses the valuation spread between small-cap and large-cap stocks. In a word, the spread is wide. In two words, the spread is really wide. Relative to large-cap stocks, small-cap stocks are really cheap.
We at AAII have long thought individual investors should consider small-cap stocks because of their historical returns. Over the long term, small-cap stocks—especially small-cap value stocks—have outperformed their large-cap brethren by a wide margin. Our Model Shadow Stock Portfolio is based on the work by Nobel laureate Eugene Fama and Dartmouth professor Kenneth French about what characteristics (aka factors) have been associated with long-term outperformance. I, myself, hold Vanguard’s Small-Cap Value Index fund (VSIAX) in my 403(b) account. Yet, none of this changes what the current data is showing.
The chart below is from John’s article and visually backs up the argument I’m making about valuations. The bars plot the median price-to-book (P/B) ratios for S&P 500 index large-cap companies and the median price-to-book ratios for S&P SmallCap 600 index companies. The black line shows the trend in the ratio between the two from 1998 through April 17, 2020.
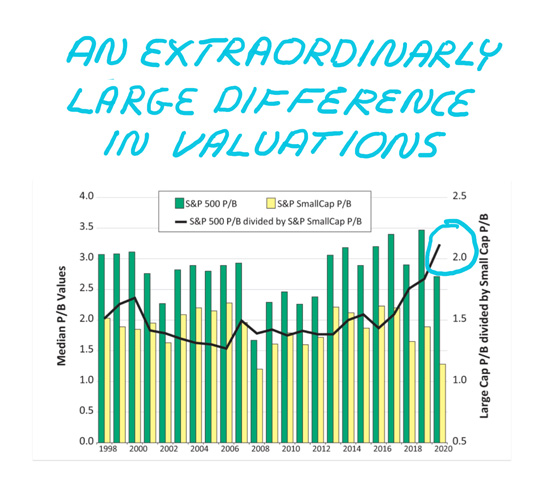
Historically, large-cap stocks have commanded higher price-to-book ratios. The median year-end price-to-book ratio for S&P 500 stocks has averaged 2.81 over the past 22 years. The median for S&P SmallCap 600 stocks has averaged 1.91 over the same period. Dividing 2.81 by 1.91 gives us a large-cap/small-cap ratio of 1.47. The bigger the ratio, the bigger the spread and the cheaper small-cap stocks are relative to large-cap stocks.
Fast-forwarding to present day, the ratio stood at 2.12 in mid-April when John created the chart. Given the market’s volatility and the reporting of first-quarter earnings, I reran the data as of Tuesday’s close: The large-cap/small-cap ratio still remains extraordinarily high at 2.07.
To confirm the big difference in relative valuations wasn’t solely attributable to the price-to-book ratio, I looked at other valuation measures; the story stayed the same. On a price-earnings (P/E) basis, the 22-year median large-cap/small-cap ratio has averaged 1.00. The ratio now stands at 1.23. (Over the last 22 years, the year-end large-cap/small-cap ratio has only been above 1.20 three times: 1998, 1990 and 2000.) On a price-to-sales (P/S) basis, the 22-year large-cap/small-cap ratio has averaged 1.45. The ratio now stands at 2.24. On a price-to-free-cash-flow (P/FCF) basis, the 22-year median large-cap/small-cap ratio has averaged 1.18. The ratio now stands 1.77. (The valuation differences for both the price-to-sales and price-to-free-cash-flow ratios are close to their April 17 record highs.)
We’re not alone in noticing the relative cheapness of small-cap stocks. Here’s what O’Shaughnessy Asset Management (OSAM) wrote in a recent report: “Using history as a guide, the current environment in small-cap stocks is almost unprecedented. When comparing the earnings yield of the cheapest small stocks (cheapest decile by price-to-earnings) to the most expensive decile of large-cap stocks in the U.S. we see a spread of more than 21%.”
Investment management firm Verdad shared a similar viewpoint: “The ratio of growth-to-value stocks went from moderately high at the end of 2015 to nearly three standard deviations above the long-term median today." They then added, "today, the cheapest 10% of stocks offer about 6x the free cash flow yield of the most expensive 10% of stocks, about the same as in 1999.”
What does this mean for the future of small-cap stocks? It depends on how much you believe in the concept of reversion to the mean. Reversion to the mean is the tendency of outlying returns and valuations to revert back to their long-term averages. A good analogy to explain this is a rubber band. When stretched, it snaps back—fiercely if stretched too far. This is what OSAM and Verdad are expecting to happen. The authors of the OSAM report observed, “Following extreme periods like this historically, small value outperformed large growth by 16.8% annualized over the following 10 years.” Verdad wrote: “Historically, these valuation ratios have been strongly mean-reverting.”
While the odds look favorable for small-cap stocks on a valuation basis, nothing is guaranteed. Relative outperformance is not the same as big gains. An asset with lackluster returns outperforms an asset with lousy returns. “Reversion to the mean is a pain” has long been muttered by practitioners—both by those who either endured lengthy periods waiting for it to happen and by those who didn’t think it would happen. Historical relationships can break down, though people have also incurred large losses by believing things are different this time. Reversion to the mean marches to its own drum and it’s extremely difficult to pick up the rhythm of the beat.

-
Exploiting the Relative Outperformance of Small-Cap Stocks – Among the periods when small-cap equities outperform is following the official end of a period of contracting economic activity.
-
How Much Small Cap Should Be in Your Portfolio? – The answer depends on your personal profile. There are reasons why you may want to overweight or underweight small-cap stocks.
The level of pessimism among individual investors about the short-term direction of the stock market is at its highest level in more than seven years. The latest AAII Sentiment Survey also shows a drop in optimism and a decline in neutral sentiment.
Bullish sentiment, expectations that stock prices will rise over the next six months, fell 6.9 percentage points to 23.7%. Optimism was last lower on October 9, 2019 (20.3%). Bullish sentiment is below its historical average of 38.0% for the ninth consecutive week and the 14th week this year.
Neutral sentiment, expectations that stock prices will stay essentially unchanged over the next six months, pulled back by 1.7 percentage points to 23.7%. Neutral sentiment remains below its historical average of 31.5% for the 12th consecutive week and the 16th time in 17 weeks.
Bearish sentiment, expectations that stock prices will fall over the next six months, rose 8.6 percentage points to 52.7%. Pessimism was last higher on April 11, 2013 (54.5%). The increase keeps bearish sentiment above its historical average of 30.5% for the 11th consecutive week.
Pessimism has been at an unusually high level for nine consecutive weeks. On five of those nine weeks, bearish sentiment has been at or above 50%. Optimism, meanwhile, is at an unusually low level for the second time in three weeks.
The continued high level of pessimism reflects the ongoing bear market and the coronavirus pandemic. However, some AAII members have been encouraged by the rebound in the stock market from its March lows. Many—but not all—have also told us that they have used the downturn to look for buying opportunities among stocks (see this month’s AAII Journal for more). Other factors influencing AAII members’ sentiment include the November elections, corporate earnings, economic growth and valuations.
In this week’s special question, we asked AAII members how the small business Paycheck Protection Program (PPP) is impacting their economic outlook. More than two out of five (43%) respondents say their outlook is mixed following the PPP. A majority of this group state that the program will have a positive impact in the short term, but it may be insufficient and unsustainable in the long term. This compares to 21% of respondents who say the program is positively impacting their economic outlook. Their rationale includes the program giving much-needed relief to small businesses and helping to offset some of the tailwinds that these businesses are facing. Additionally, 19% of respondents state that the PPP has not impacted their economic outlook while 17% state that the program is negatively impacting their long-term outlook. The rationale of the latter group includes unsustainable debt levels and concerns regarding higher tax expenses in order to pay for the program.
Here is a sampling of the responses:
- “The PPP requires that 75% of the funds received are spent on payroll expenses. The goal, of course, is to get employees back on payroll and off of unemployment. However, the funds do not address the most pressing need of most small businesses, which is to pay vendors for product received. Covering payroll is nice but maintaining relationships with suppliers is equally critical to viability.”
- “I’m not totally sure but it seems encouraging. At least the government is making an attempt to shore up the small business community. We can only hope that a quick and healthy rebound will generate the tax revenue necessary to fund the programs.”
- “No matter what Congress enacts in the near term we will continue to have dire news over the next several months.”
- “It may allow some small businesses to survive that otherwise might not have. But, like everything else the government does, it has been mismanaged. I don’t believe the assistance has gotten to the people who need it.”

Bullish: 23.7%, down 6.9 points
Neutral: 23.7%, down 1.7 points
Bearish: 52.7%, up 8.6 points
Bullish: 38.5%
Neutral: 31.0%
Bearish: 30.5%
AAII Asset Allocation Survey
AAII members’ exposure to fixed income rose to its highest level in seven years last month. The April AAII Asset Allocation Survey also shows an increase in equity exposure and a decrease in cash allocations.
Stock and stock fund allocations rebounded by 2.3 percentage points to 57.5%. The historical average is 61.0%.
Bond and bond fund allocations rose 0.8 percentage points to 19.5%. Fixed-income allocations were last higher in April 2013 (19.7%). Last month’s increase keeps exposure to bonds and bond funds above their historical average of 16.0% for the 14th consecutive month and the 15th time in 16 months.
Cash allocations pulled back by 3.1 percentage points to 23.0%. Cash exposure is equal to its historical average.
The increase in bond exposure occurred as yields fell and the stock market remained highly volatile. Though they are at a seven-year high, fixed-income allocations are only slightly above the level we saw last August (19.4%).
While many individual investors made changes to their portfolios amidst the coronavirus volatility, the majority are continuing to stick to their portfolio strategies. The May AAII Journal’s Big Question provides more insights into how AAII members have reacted.

April AAII Asset Allocation Survey results:
- Stocks and stock funds: 57.5%, up 2.3 percentage points
- Bonds and bond funds: 19.5%, up 0.8 percentage points
- Cash: 23.0%, down 3.1 percentage points
April AAII Asset Allocation Survey details:
- Stocks: 24.9%, up 2.2 percentage points
- Stock Funds: 32.6%, up 0.2 percentage points
- Bonds: 4.0%, up 0.6 percentage points
- Bond Funds: 15.5%, up 0.2 percentage points
Historical Averages:
- Stocks/Stock Funds: 61.0%
- Bonds/Bond Funds: 16.0%
- Cash: 23.0%
The numbers are rounded and may not add up to 100%.
The AAII Asset Allocation Survey has been conducted monthly since November 1987 and asks AAII members what percentage of their portfolios are allocated to stocks, stock funds, bonds, bond funds and cash. The survey and its results are available online at: www.aaii.com/investor-surveys.
- Stocks and Stock Funds: 57.5%, up 2.3 percentage points
- Bonds and Bond Funds: 19.5%, up 0.8 percentage points
- Cash: 23.0%, down 3.1 percentage points
- Stocks: 24.9%, up 2.2 percentage points
- Stocks Funds: 32.6%, up 0.2 percentage points
- Bonds: 4.0%, up 0.6 percentage points
- Bond Funds: 15.5%, up 0.2 percentage points
- Stocks/Stock Funds: 62.0%
- Bonds/Bond Funds: 16.0%
- Cash: 22.0%
Take the Asset Allocation Survey.
April 30, 2020 I Rebalanced My Portfolio After Sinning a Little
April 23, 2020 Volatility Has Been Extraordinarily High, But Is Declining
April 16, 2020 What to Do With the Stimulus Check
April 9, 2020 The CARES Act and Tax Rule Changes

Discussion
Robert from VA posted over 6 years ago:
..and using the same rubber band analogy, just remember that, if the band is stretched too far, it does not snap back at all; it breaks. I would caution an older investor not to bet that the reversion to the mean will happen within his/her useful investing horizon. The older investor should balance the desire for above average gains with as need for caution. Some of the large caps offer a measure of stability that small caps do not.
Steven from Iowa posted over 6 years ago:
Any business can simply close the shop, lock the doors, and declare any outstanding shares worthless. Remember Enron? The smaller the business the easier this can happen. If I were to invest in small caps it would be a broad index fund. But I am getting to the end of the game. I simply do not have 30 years to wait for tides to change.
Rob A. from NC posted over 6 years ago:
Please add Alcon (ticker ALC) to the AAII databse/universe. It was created out of a spinoff from Novartis in 2019. How can I enter my holding info on it if AAII won't recognize it? I've written to AAII tech support before, to no avail. And no response, either.
You need to log in as a registered AAII user before commenting.
Create an account