

Volatility Has Been Extraordinarily High, But Is Declining
by Charles Rotblut | April 23, 2020
I’ve been describing the price swings we’ve seen this year by writing, “Mr. Market is in a high-speed elevator with the lights blacked out.” The phrase is a reference to the adage of the market taking the stairs up but the elevator down.
What we’ve seen since late-February are big swings in prices in both directions. It’s not just the magnitude of the daily price moves but the number of big moves that are extraordinary. The chart to the right demonstrates this. It’s an updated version of one I displayed when I spoke to our AAII Phoenix Chapter two weeks ago.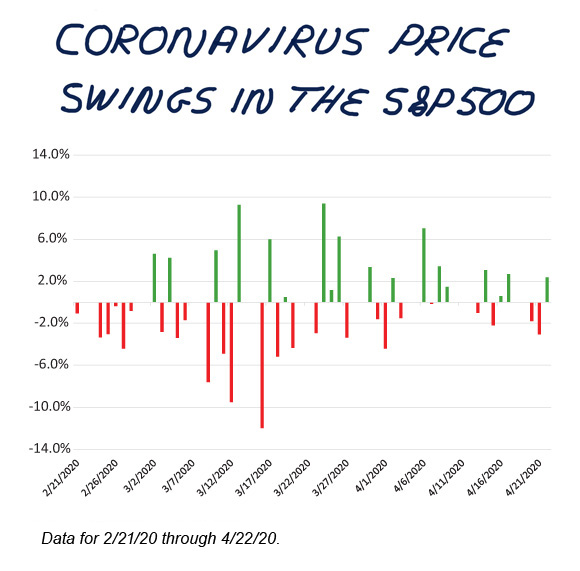
The green bars reflect up days and the red bars reflect down days. The horizontal bars are spaced in two-percent increments, positive and negative. The range is down 14% to up 14%. As you can see by simply eyeballing it, there has been a lot of volatility.
To put these numbers into perspective, I’m going to share some historical data. I’ve been tracking the number of days with price moves of greater than 1% and 2% for several years. The data I’ve compiled goes back to the start of 2011. During that time span, the largest number of days in a single calendar year with a closing change in the S&P 500 index of greater than or less than 2% was 35—for the year of 2011. As of Wednesday’s close, we’ve already experienced 30 such days for 2020—and it’s only April!
Another way to look at volatility is to monitor the trend. In a webinar we hosted last week, Sam Stovall—the chief investment strategist at CFRA Research—showed a chart tracking the 15-day average of the difference between the S&P 500’s daily high and low prices. It peaked on March 27 at 6.2%. Since then, the average has come down and currently sits at 2.4%, which is still unusually high. (The updated calculation is my own.) When we started 2020, the 15-day average of the index’s intraday highs and lows was 0.5%.
The good news about the volatility is that it has been coming down from its peak. Stovall says that once the peak in volatility has been set, a bottom for the market is usually set within 30 days. During the webinar, he explained how the intraday volatility peaked during the financial crisis on October 28, 2008. Many large-cap stocks went on to bottom in price on November 20, 2008. The March 2009 bottom of the bear market ended up just being a retest for them.
This does not mean we won’t see more price swings over the short term—we very well could. However, the volatility going forward won’t be as severe as it recently has been if history holds. Still, if you’re trying to determine when to put money to work or make adjustments to your portfolio, it can be tough to decide when to act. Mr. Market is good at prompting people to second-guess their decisions.
There are a few guidelines I can offer to those of you who are feeling indecisive. The first is to simply take a deep breath and act. If you’re not sure when to act, then you’re not likely to gain much clarity by waiting longer. The second is to set upper and lower price boundaries based on some repeatable and logical process. Seeking a close above the 200-day moving average is one way. Another is to use to price boundaries such as if the S&P 500 rises to within 14% of its high (2,912) or pulls back to 21% below (2,675). (If you’re truly convinced the stock market is going to pull back from its recent gains you could set a lower target such as 28% below, which would be 2,438. The numbers are just suggestions and not forecasts.) These boundaries are based on data from Stovall showing that putting money into stocks whenever the S&P 500 falls by an interval of 7% from its high has historically worked. The third option is to simply circle a date on your calendar to decide when you’ll act by. This gives you a period of time to watch the markets without letting too much time go by. Is it still arbitrary? Yes, but it’s still better than being indecisive for an extended period of time.

-
Should You Dollar Cost Average or Lump-Sum Invest? – While the answer is influenced by what you invest in, Sam Stovall found lump-sum approaches generally work better.
-
The Temptation to Trade Reduces Returns – Several studies, including this one, have found excessive trading to have a negative impact on wealth.
Optimism among individual investors about the short-term direction of the stock market plunged to a six-month low in the latest AAII Sentiment Survey. Pessimism rebounded back up to 50% while neutral sentiment continued to climb.
Bullish sentiment, expectations that stock prices will rise over the next six months, fell 10.0 percentage points to 24.9%. Optimism was last lower on October 9, 2019 (20.3%). Bullish sentiment is below its historical average of 38.0% for the seventh consecutive week and the 12th week this year.
Neutral sentiment, expectations that stock prices will stay essentially unchanged over the next six months, rose 2.7 percentage points to 25.1%. This is an eight-week high. Nonetheless, neutral sentiment remains below its historical average of 31.5% for the 14th time in 15 weeks.
Bearish sentiment, expectations that stock prices will fall over the next six months, rebounded by 7.3 percentage points to 50.0%. This is the fourth time in seven weeks with pessimism at or above 50%. Bearish sentiment is also above its historical average of 30.5% for the ninth consecutive week.
Bullish sentiment is now at an unusually low level (more than one standard deviation below average). Historically, such readings have been followed by above-average and above-median six- and 12-month returns in the S&P 500 index. Bearish sentiment, meanwhile, is at or above 50% for only the 65th time in the entire history of the survey (more than 1,700 weekly readings).
The continued high level of pessimism reflects the ongoing bear market and the coronavirus pandemic. Some AAII members have been encouraged by the rebound in the stock market from its March lows, however. Many—but not all—have also told us that they have used the downturn to look for buying opportunities among stocks. Other factors influencing AAII members’ sentiment include the November elections, corporate earnings, economic growth and valuations.
For this week’s special question, we asked AAII members how the decision by some companies to cut or suspend their dividends is impacting their investment decisions. Slightly more than one out of three (34%) say that recent dividend cuts have led them to conduct additional analysis. Many in this group cite the importance of investigating what motivated the company to cut its dividend and where the company stands in terms of balance sheet strength. This group compares to 29% of respondents who state that dividend changes are resulting in earlier-than-expected portfolio adjustments to ensure a steady stream of dividend income. About 17% of respondents state that dividend cuts are impacting how much they are investing overall, with a majority in this group saying that they are selling holdings that are making such changes. Finally, 20% of respondents state that recent dividend changes are having no impact on their investment decision thus far.
Here is a sampling of the responses:
- “A lot! Income investing has done extremely well for me over the past 25 years, and I’m a believer that it’s the true stealth wealth builder. I will make whatever changes to my portfolio are necessary to keep those quarterly checks rolling in.”
- “First of all, why did they cut or suspend the dividend? Was this an explainable cut that was temporary or long-lasting? If this were a long-term decision, I would be likely to sell, otherwise, I would stay with the stock.”
- “Makes sense to preserve capital. I don’t think this short-term policy is unwarranted and it will not affect my investment decisions.”
- “These are tough times and dividend cuts are understandable. If it’s a good company, the dividends will come back, and I plan to hold them even if they cut them now. The last dividend company I cut from my portfolio when they announced a dividend cut was Boeing. In my view, they had some fundamental problems that they will not overcome in a while.”

Bullish: 24.9%, down 10.0 points
Neutral: 25.1%, up 2.7 points
Bearish: 50.0%, up 7.3 points
Bullish: 38.5%
Neutral: 31.0%
Bearish: 30.5%
April 16, 2020 What to Do With the Stimulus Check
April 9, 2020 The CARES Act and Tax Rule Changes
April 2, 2020 Measuring Companies’ Financial Strength Amid Spike in Borrowing
March 26, 2020 Helpful Financial Planning Actions You Can Do While Sheltering in Place

Discussion
Jim G from California posted over 6 years ago:
Looks like there's a mismatch between the graph and the subtitle below the graph. This appears to be a display of market volatility over a two month span ending April 21st, 2020. Nonetheless, there's a caption saying the data are from January 2nd, 1979 through April 22nd, 2020. I suspect the caption is in error. Incidentally, volatility has been exceptionally low for the past two or three years. While we've had a heck of a drop in the last two months as well as a partial recovery, you have to realize that we had abnormally low volatility prior to the recent pandemic and economic shutdown.
You need to log in as a registered AAII user before commenting.
Create an account