

Measuring Companies’ Financial Strength Amid Spike in Borrowing
by Charles Rotblut | April 02, 2020
One thing we’ve noticed here at AAII is an increase in the number of corporations drawing on their credit lines. When such events are observed on a company-by-company basis, the data is anecdotal. A small bunch of trees does not make a forest.
In such cases, it’s useful to step back and see if data offering a more macro view is available. There are two pieces of data we can pinpoint that support that what we are seeing are in fact signs of a larger pattern as opposed to actions by outliers.
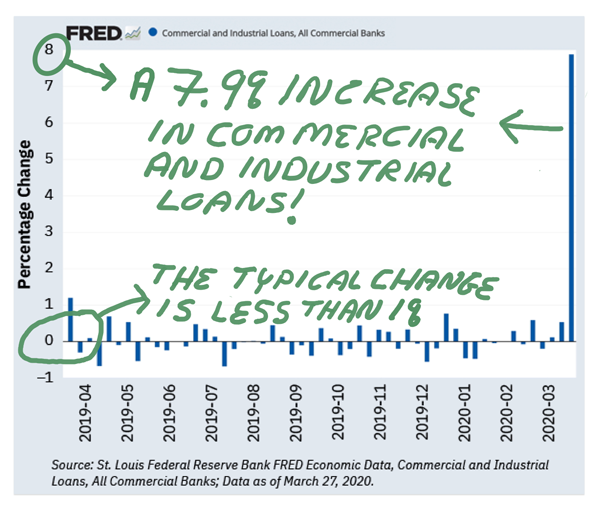
The first piece of data is displayed in the chart on the right side. It is from the St. Louis Federal Reserve’s FRED economic database. The bars indicate the weekly percentage change in commercial and industrial loans from commercial banks. Most weeks, the change in such loans rises or drops by no more than one percent. The increase during the week of March 18, 2019, was 7.9%! The Wall Street Journal’s Daily Shot blog captioned a similar chart with, “U.S. business loan balances jumped by the highest percentage on record as companies rushed to tap their credit lines.”
The second piece of data comes from the debt markets. It is the issuance of investment grade bonds. This figure is frequently reported by financial news outlets. Last week, corporations issued about $73 billion of investment grade debt. It was “roughly 21% higher than the previous high-water mark reached in 2013,” according to data from data firm Dealogic cited by The Wall Street Journal.
Corporations clearly have moved quickly to add cash to the balance sheets. Seeing them boost cash levels as shelter-in-place orders were being enacted across the country is not surprising—it’s the speed and scale that is. Companies across the country have rushed to boost their cash coffers by tapping credit facilities and issuing bonds. In turn, the Federal Reserve has reacted quickly to ensure that the banking system and the credit markets are holding up.
Credit is most available at favorable terms to those who are in the best position to repay it. As investors, we want to own shares and bonds of companies we think are capable of meeting their obligations. This assessment can be made by analyzing the financial statements. Is cash from operating activities and free cash flow positive? By what margin do earnings exceed interest expense? How much cash is on the balance sheet? What is the ratio of long-term debt to equity? Asking and answering these questions will tell you how fiscally sound a company is.
Other measures can also provide some insights. If cash flow or free cash flow is negative, you can calculate the cash burn rate. This is done by dividing the current “cash” level (cash plus marketable securities) by cash from operations (or free cash flow) over the trailing 12 months. Multiplying the result by 12 gives you a monthly rate. (My colleague Wayne Thorp will discuss the cash burn rate in greater detail in the April Stock Superstars Report monthly newsletter, available tomorrow.) Another is the Altman Z-Score or the Z double prime score. Both indicate whether a company is at risk of incurring significant financial distress or even bankruptcy. Be wary of companies whose Altman Z-Score or Z double prime score is 1.8 or lower.
When doing this analysis, consider the timing of the data. Most companies will not report first-quarter results until later this month or in May. As far as the group of companies to have reported over the past two or so weeks are concerned, their financial data was for periods ending prior to the recent spike in corporate borrowing. Though this might seem problematic, it will provide a benchmark of the financial health of the companies before the recent rush for cash. Companies who were already on financially weak ground are likely to become even more stressed should the post-pandemic economic rebound take longer and/or be weaker than expected.

-
Using the Z-Score to Assess the Risk of Bankruptcy – The creator of this financial distress indicator explains how to calculate and use it.
-
16 Financial Ratios for Analyzing a Company’s Strengths and Weaknesses – These 16 ratios enable investors to assess the financial strength, profitability and efficiency of a company.
Pessimism among individual investors about the short-term direction of the stock market is below 50% for the first time in four weeks according to the latest AAII Sentiment Survey. Neutral sentiment, meanwhile, continues to be at an extraordinarily low level.
Bullish sentiment, expectations that stock prices will rise over the next six months, rebounded by 1.3 percentage points to 34.2%. Optimism has been below its historical average of 38.0% during nine out of the first 14 weeks of 2020.
Neutral sentiment, expectations that stock prices will stay essentially unchanged over the next six months, rose 1.0 percentage points to 16.0%. Neutral sentiment remains below its historical average of 31.5% for the 11th time in 12 weeks.
Bearish sentiment, expectations that stock prices will fall over the next six months, pulled back by 2.3 percentage points to 49.7%. The decrease ends of a streak of three consecutive weekly readings above 50%. The historical average is 30.5%.
This week’s increase was only enough to move neutral sentiment up to the 46th lowest reading out of more than 1,700 weekly results. Neutral sentiment was previously at 16.0% on August 31, 1990, October 19, 2006, and August 13, 2009.
Pessimism continues to be at an unusually high level (more than one standard deviation above the historical average). Historically, unusually high levels of bearish sentiment have had a weaker association with above-average returns for the S&P 500 index over the following six- and 12-month periods than unusually low levels of optimism. (Bullish sentiment remains within its typical historical range.)
The continued high level of pessimism reflects the ongoing bear market, the coronavirus pandemic and, to a lesser extent, the oil price cut announced by Saudi Arabia. Many—but not all—individual investors are using the downturn to look for buying opportunities among stocks. Other factors influencing AAII members’ sentiment include the November elections, corporate earnings, economic growth and valuations.
This week’s special question asked AAII members how the coronavirus aid legislation (the CARES Act) is impacting their economic expectations. Two out of five (40%) of respondents say that the aid package is improving their short-term outlook, however, their long-run outlook is still pessimistic. Many within this group believe that the economy will require more aid in the future and that a greater amount should be allocated to small businesses/families. In contrast, 27% of respondents state that their economic outlook has deteriorated following the aid package announcement. Rationale includes unsustainable debt levels and expectations of high inflation in the years to come.
Additionally, 19% of respondents state that the coronavirus aid package has positively affected their economic expectations while 13% of respondents state that the package has had no effect on their outlook thus far.
Here is a sampling of the responses:?
- “I think it is a band-aid and we will need lots more before this is over. What really concerns me is the national debt.”
- “It will help slow the economic downturn but won’t prevent a recession. Recession may be milder as a result of the aid package. I expect further aid to come for specific segments of the economy as we get close to the election.”
- “Mixed. The aid to individuals is necessary. The aid to big corporations and industry groups will be misused and will fill the pockets of powerful but greedy folks who will enjoy windfall profits instead of aiding the economy.”
- “Worry that the financial ‘cure’ may prove worse than the disease.”

Bullish: 34.2%, up 1.3 points
Neutral: 16.0%, up 1.0 points
Bearish: 49.7%, down 2.3 points
Bullish: 38.5%
Neutral: 31.0%
Bearish: 30.5%
AAII Asset Allocation Survey
Individual investors’ exposure to equities plunged to the lowest level since late 2011. The March AAII Asset Allocation Survey also shows cash holdings jumping to their highest level in more than a decade.
Stock and stock fund allocations fell 10.9 percentage points to 55.2%. This is the smallest exposure to equities since November 2011 (53.1%). Last month’s drop ended a streak of 83 consecutive months with stock and stock fund allocations above their historical average of 61.0%.
Bond and bond fund allocations declined 0.4 percentage points to 18.7%. Fixed-income allocations are above their historical average of 16.0% for the 13th consecutive month and the 14th time in 15 months.
Cash allocations surged 11.3 percentage points to 26.1%. Cash allocations were last higher in November 2009 (27.1%). The big increase ends a streak of 99 consecutive months with cash allocations below their historical average of 23.0%.
The big shifts in allocation occurred as the 11-year bull market for stocks ended last month. Though cash holdings increased by a large amount, some individual investors have either been buying stocks or actively looking for bargains. The survey period lasted the entire month of March.
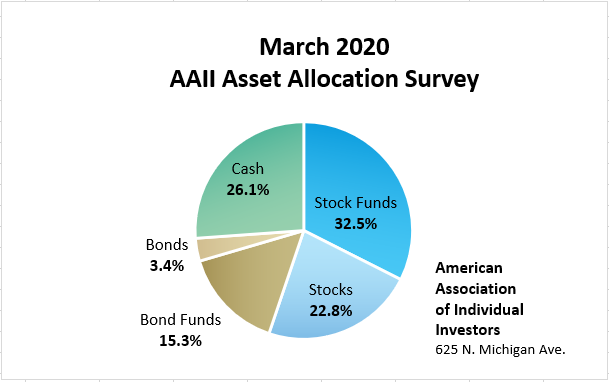
March AAII Asset Allocation Survey results:
- Stocks and stock funds: 55.2%, down 10.9 percentage points
- Bonds and bond funds, 18.7%, down 0.4 percentage points
- Cash: 26.1%, up 11.3 percentage points
March AAII Asset Allocation Survey details:
- Stock funds: 32.5%, down 5.0 percentage points
- Stocks: 22.8%, down 5.9 percentage points
- Bond funds: 15.3%, down 0.1 percentage points
- Bonds: 3.4%, down 0.3 percentage points
Historical Averages:
- Stocks/Stock Funds: 61.0%
- Bonds/Bond Funds: 16.0%
- Cash: 23.0%
The numbers are rounded and may not add up to 100%.
The AAII Asset Allocation Survey has been conducted monthly since November 1987 and asks AAII members what percentage of their portfolios are allocated to stocks, stock funds, bonds, bond funds and cash. The survey and its results are available online at: www.aaii.com/investor-surveys.
- Stocks and Stock Funds: 55.2%, down 10.9 percentage points
- Bonds and Bond Funds: 18.7%, down 0.4 percentage points
- Cash: 26.1%, up 11.4 percentage points
- Stocks: 22.8%, down 5.9 percentage points
- Stocks Funds: 32.5%, down 5.0 percentage points
- Bonds: 3.4%, down 0.3 percentage points
- Bond Funds: 15.3%, down 0.1 percentage points
- Stocks/Stock Funds: 62.0%
- Bonds/Bond Funds: 16.0%
- Cash: 22.0%
Take the Asset Allocation Survey.
March 26, 2020 Helpful Financial Planning Actions You Can Do While Sheltering in Place
March 19, 2020 The Berserk Financial Markets Provide Opportunities for Tax-Saving Tactics
March 12, 2020 The Barbell Strategy—A Simple Way of Being Both Aggressive and Conservative
March 5, 2020 Income Investing Suggestions for Record Low-Yield Environment

Discussion
No comments have been added yet. Add your thoughts to the discussion!
You need to log in as a registered AAII user before commenting.
Create an account