

Correlations Between Stocks and Bonds Are Not Stable
by Charles Rotblut | June 24, 2021
One of the big arguments for portfolio diversification is correlation. Correlation in simple terms is how similar, dissimilar or opposite the returns of different investments are. Correlations are rarely static. They ebb and flow. Over longer periods of time, correlations between different types of investments can move closer to or further away from each other.
Consider two broad asset class groups: large-cap stocks (defined as the S&P 500 index) and 10-year Treasury bonds. An analysis by investment firm PGIM found that the correlations varied significantly over the past 70 years (1950–2020). At the low end, monthly correlations for the five-year period ending in 2015 were –0.66. At the high end, correlations were 0.45 for the five-year period ending in 1995.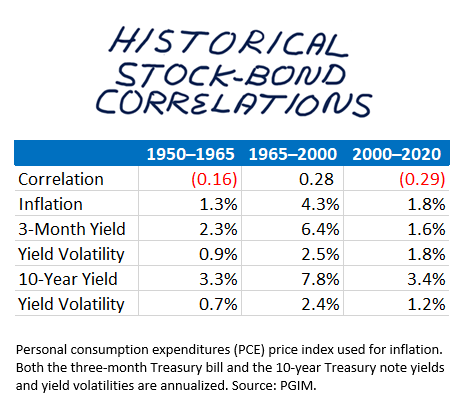
(Correlations, for those of you not familiar with them, range from –1.0 to 1.0. A value of –1.0 occurs when the returns of two investments move in opposite directions. A value of 1.0 occurs when their returns move in the same direction. A correlation of 0.0 implies that the returns are independent of one another.)
Authors Junying Shen and Noah Weisberger identified three key periods where stock-bond correlations were either negative or positive. Correlations were –0.16 between 1950 and 1965 and –0.29 between 2000 and 2020. Correlations were a positive 0.28 between 1965 and 2000.
The obvious question is why?
One reason given by Shen and Weisberger is the level and volatility of short-term bond yields. Yields on the three-month Treasury note were 6.4% on an annualized basis between 1965 and 2000. Volatility in those yields was 2.5% annualized. Both yields and yield volatility were lower during the negative correlation periods.
During the positive correlation period of 1965–2000, inflation was 4.3%. Inflation ran at 1.3% between 1950 and 1965 and at 1.8% between 2000 and 2020.
Another reason given was macroeconomic policy. Discretionary monetary policy—such as a large rate hike that slows economic growth but supports the dollar—has been associated with positive correlations. Likewise, expansionary fiscal policy can contribute to positive correlations if it raises interest rates and crowds out private investment.
In contrast, raising rates during growth periods to fend off inflation reflects a rules-based approach. When monetary policy reflects economic conditions, negative stock-bond correlations have been more likely to occur. The link with fiscal policy is tougher to define but the authors suggest if interest rates are above growth rates, then stock-bond correlations are more likely to be positive.
Shen and Weisberger did not give an explicit forecast for where they think correlations are going. Rather, they struck a middle ground of sorts by suggesting chief investment officers without strong macroeconomic policy views anticipate a stock-bond correlation of 0.0.
Even if correlations were to become positive again, diversification benefits will be realized. Those benefits will still be reduced as correlations rise above 0.0 but the magnitude of the reduction depends where on the scale of 0.0 to 1.0 those correlations are.
The concept of correlations helps to explain how diversification works. Changes in correlations also explain why the benefits of diversification are more apparent during some years and less apparent during others.
Attempting to optimize your portfolio based on prevailing correlations is nowhere as effective as merely having a mix of stocks, bonds and cash aligned with your personal goals. Adhering to simple strategies like bucket strategies (allocating to risky and safe assets based on the timing of when cash flows are needed) or a preset percentage mix of stocks, bonds and cash has a far greater positive impact on long-term wealth.

- Correlations within asset classes like stocks also rise and fall as portfolio manager Bernard Horn explained in this 2010 AAII Journal article.
- Misperceptions about diversification have occurred when correlations have risen during previous bear markets.
- Beyond stock-bond correlations, news about monetary policy and government spending have been found to lead to big daily moves in the stock market.
- This month’s AAII Journal online exclusive offers strategies for diminishing inflation’s impact on your portfolio.
- Wondering how AAII’s four model portfolios—Model Shadow Stock Portfolio, Stock Superstars Report, Dividend Investing and VMQ Stocks—compare and contrast to each other? Tune into Wednesday’s webinar to find out (note the special time).
AAII Sentiment Survey
Neutral sentiment extended its streak of above-average readings to nine consecutive weeks. The latest AAII Sentiment Survey also shows declines in optimism and pessimism.
Bullish sentiment, expectations that stock prices will rise over the next six months, fell 0.7 percentage points to 40.4%. Even with the decline, optimism remains above its historical average of 38.0% for the 27th week out of the past 32 weeks.
Neutral sentiment, expectations that stock prices will stay essentially unchanged over the next six months, rose 3.5 percentage points to 36.3%. Neutral sentiment is above its historical average of 31.5% for the ninth consecutive week.
Bearish sentiment, expectations that stock prices will fall over the next six months, declined 2.8 percentage points to 23.3%. Bearish sentiment is below its historical average of 30.5% for the 20th consecutive week.
At current levels, all three readings are within their typical historical ranges.
The return to normalcy from the coronavirus pandemic, monetary and fiscal stimulus and inflationary pressures are influencing individual investors’ outlook for stocks. Other factors include earnings, the Biden administration’s initiatives and valuations.
In this week’s special question, we asked AAII members to share how they felt about the Federal Reserve continuing to wait until 2022 or 2023 before raising interest rates.
Nearly two out of five respondents (39%) say that they disagreed with the Federal Reserve’s strategy to delay the raising of interest rates. Many within this group say that there was already evidence present pointing to inflation and that the Federal Reserve needs to take action now in order to avoid an extremely inflationary economy.
This compares to 31% of respondents who say that the Federal Reserve’s decision to wait was the correct one, as this allows them time to analyze more market data and metrics that are currently unavailable. About 15% of respondents are skeptical of the Fed’s announcement, as many say that the Federal Reserve would act sooner than stated and they would take action regardless of the timeframe. In addition, about 8% of respondents are indifferent about the Fed’s decision to wait and say they were more focused on what they could control in the near future, such as the return on their portfolios.
Here is a sampling of the responses:
- “I think the Fed is behind the curve and needs to be raising rates now and adjusting the money supply to rein in inflation.”
- “I think a wait-and-see approach is warranted. The reopening of America will be a bumpy ride considering labor availability and the prospect of coronavirus variants. Such volatility makes data used for determining interest rate policy less than reliable.”
- “That is what they are saying now but it can change depending on what happens in the next few months.”
- “I do not change my asset allocation based on daily news or how I ‘feel’ about it. I select an allocation that I can live with no matter what happens. I am a long-term investor.”
Bullish: 40.4%, down 0.7 points
Neutral: 36.3%, up 3.5 points
Bearish: 23.3%, down 2.8 points
Bullish: 38.0%
Neutral: 31.5%
Bearish: 30.5%
See more Sentiment Survey results.

June 17, 2021 Helpful Resources for Dividend Investors
June 10, 2021 Compound Interest Returns and Your Portfolio
June 3, 2021 Periodic Adjustments Are Key for Preserving a Portfolio's Survival
May 27, 2021 Creating Watchlists to Track Investing Ideas

Discussion
Bill from Maryland posted over 5 years ago:
I agree with all the points in the article. I would like to add my observations and opinions re. the variability of correlation between stock and bond funds - on a much smaller time scale. For the past 3.5 years, I have been tracking correlation (using the Excel function) of adjusted daily close prices among 4 funds: a large-cap domestic stock ETF (VV), a small-cap domestic stock ETF (VBR), a corporate bond ETF (VCSH), and a govt bond fund (VGSH). I have noticed that correlation between stock and bond funds increases by large amounts during periods when prices of both asset classes are declining (i.e. likely due to systematic market-level factors). Unfortunately, those are the very times that correlation and diversification are supposed to benefit the investor by causing him/her to build a portfolio with anti-correlated assets: supposedly reducing the drop in their portfolio value during market declines and thus reducing the urge to sell. When prices are relatively flat or increasing, my correlations have shrunk to insignificant levels. The great limitation of Pearson's coefficient for our use is that it expresses only the degree of similarity or dissimilarity between the linear trends of each data set. And of course, fund prices are anything but linear. Other techniques like scatter plots, run charts, and histograms are more effective indicators of how similar the behavior of two non-linear data sets are over time. If one must have the relationship expressed in a single number, rank correlation methods can be less deceiving for time series data (e.g. Spearman's Rank Correlation Coefficient.) The above points to a question: what is a significant correlation coefficient value? I think the answers are the ubiquitous, "it depends" and "it's all relative". In the field of human drug testing, for example, a coefficient as low as .3 might be considered significant enough to affect decisions that are made about that drug. In other fields, a coefficient of .8 might be considered an insignificant positive correlation. So the answer is that the significance of a correlation coefficient is the degree of regret that is predicted as a result of making a bad decision based on that data. To me, that's not a helpful answer. So the moral of this long story is that we can allow data set statistics to influence our investing decisions because something has to, but we shouldn't think that the statistics are revealing any hidden reality. Mark Twain said it best: "... there are lies, damn lies, and statistics." We're playing a game.
John Lambert from NJ posted over 5 years ago:
Bonds have unstable correlations to Stocks and current yields lower than inflation. Are Bonds currently an investment or a divestment? Many investors look at the recent past and extrapolate into the future. Another approach would be to look at the last time Bond yields were very low in the 1940s and observe the results 10 to 30 years later. Decades of losses for safe, dependable, and diversifying Bonds!
You need to log in as a registered AAII user before commenting.
Create an account