

Periodic Adjustments Are Key for Preserving a Portfolio's Survival
by Charles Rotblut | June 03, 2021
The ability to make periodic adjustments to one’s portfolio is key to maintaining its survival. This is especially the case for retirees taking retirement withdrawals, including those in the Financial Independence, Retire Early (FIRE) community. (There are insights in this week’s commentary for those of you who are still working too.) These adjustments do not require tearing up one’s portfolio but rather being flexible and having levers you can pull when needed.
An analysis by finance professor Jack C. DeJong Jr. and financial planner John H. Robinson of the so-called lost decade (2000–2009) showed why. They looked at hypothetical portfolios for a person who retired at the end of 1999 and followed William Bengen’s 4% withdrawal strategy. The 4% rule calls for withdrawing the equivalent of 4% of retirement savings during the first year of retirement and then adjusting that amount upward each year for inflation.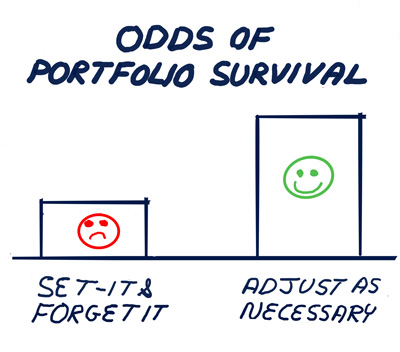
Portfolios with a 60% to 80% allocation to equities ended 2020 with less than one-quarter of their starting balances according to DeJong and Robinson’s analysis. Portfolios with allocations of 90% or 100% to equities ran out of money prior to 2020 (meaning they failed). The most successful allocation in terms of ending wealth was 100% bonds. Keep in mind how much bond yields fell over the past 20 years. Investors won’t have the same tailwind of falling rates going forward.
Seeing these numbers, I decided to run a modified version of my rebalancing analysis over the same 20-year period. I used an adjusted version of AAII’s moderate portfolio allocation strategy to get close to the 60% stocks/40% bonds allocation used by DeJong and Robinson. I used return data for Vanguard mutual funds, which had a much lower cost than the 1% annual expense ratio they assumed. This high cost contributed to the portfolio failures the study’s authors found. It is very easy for individual investors to spend far less than 1% in annual investment expenses.
The withdrawal rate was bumped up to Bengen’s revised 4.5%, which was a higher hurdle for the portfolios to climb. Withdrawals were taken at the start of each calendar year. Annual returns were used as opposed to the monthly returns used by DeJong and Robinson. Not quite apples to apples, but close enough to provide some general comparisons.
The outcomes varied on what a hypothetical retiree did. A set-it-and-forget-it strategy of annual rebalancing and following the 4.5% inflation-adjusted withdrawal rate left the retiree with approximately 20% less wealth than they had at the start of retirement. Periodic rebalancing whenever any of the asset class groups drifted off-target by more than five percentage points resulted in the retiree having 2% less wealth than they had at the start of retirement. The big difference in ending wealth was that rebalancing prompted the retiree to increase their exposure to stocks when prices were low. (The portfolio declined in both scenarios because more than $110,000 in withdrawals was taken out of a portfolio with a $100,000 starting balance.)
When I reran the numbers using the 2% return on bonds assumed by DeJong and Robinson, the tables turned. Not rebalancing was the better strategy. The reason is simple: Stocks enjoyed a bull market run between 2009 and 2020. At the end of 2008, the two strategies were about even. During the remaining 11 years, the larger equity exposure from not rebalancing helped. Nonetheless, the ending balance still represented a 35% decrease over the 20-year period after accounting for withdrawals. (Keep in mind that the numbers assume historical returns for equities.)
Choosing whether or not to periodically rebalance should not be the only option in your toolbox.
Having the ability and willingness to adjust withdrawals—especially when it comes to reducing them—goes a long way toward reducing the risk of outliving your money (aka longevity risk). DeJong and Robinson described their analysis as a “wake-up call to financial planners and consumers about the danger of blindly following the 4% rule.” (Cutting back on spending during periods of economic or financial turbulence can help those who are working.)
AAII founder Jim Cloonan’s Level3 withdrawal strategy allocates two to four years of planned withdrawals to safe assets. When the market is at or near its highs, withdrawals are made from the risky part of the portfolio. When the market is down, the reservoir of safe assets is tapped. This gives the portfolio time to recover as the investor avoids selling stocks at depressed prices.
A deferred annuity can provide a backstop late in life. A reverse mortgage is another backstop. Costs, estate planning wishes and the contract details for each need to be considered.
Those of you who are still working can consider boosting savings. Choosing to delay the claiming of Social Security benefits would provide you with more cash flow throughout retirement. Working longer would not only provide you with more cash flow, but it also reduces the period over which retirement savings would be withdrawn. It can potentially have beneficial health benefits too.

- John Bajkowski explained how to optimize portfolio withdrawals with the Level3 strategy.
- William Bengen explained his 4% withdrawal rule and shared other insights on retirement portfolios with me in this 2018 interview.
- The June AAII Journal is now online. In it, Craig Israelsen provides insights into how long the long run is when it comes to setting return expectations.
- Be sure to tune in to next Wednesday’s Individual Investor Show. We’ll be discussing stock splits, how to take advantage of the My Screens feature on AAII.com and more.
AAII Sentiment Survey
Bearish sentiment among individual investors about the short-term direction of the stock market dropped to its lowest level since January 2018. The latest AAII Sentiment Survey also shows a decrease in neutral sentiment and an increase in optimism.
Bullish sentiment, expectations that stock prices will rise over the next six months, rose 7.6 percentage points to 44.1%. Optimism is above its historical average of 38.0% for the first time in four weeks and the 24th week out of the past 29 weeks.
Neutral sentiment, expectations that stock prices will stay essentially unchanged over the next six months, declined 1.0 percentage points to 36.2%. Neutral sentiment remains above its historical average of 31.5% for the sixth consecutive week and the seventh time this year.
Bearish sentiment, expectations that stock prices will fall over the next six months, fell 6.7 percentage points to 19.8%. Pessimism was last lower on January 3, 2018 (15.6%). Bearish sentiment remains below its historical average of 30.5% for the 17th consecutive week.
At current levels, pessimism is unusually low. Historically, unusually low readings for bearish sentiment have been followed by below-average six- and 12-month returns for the S&P 500 index. Bullish and neutral sentiment are within their typical historical ranges.
The return to normalcy from the coronavirus pandemic, monetary and fiscal stimulus and inflationary pressures are influencing individual investors’ outlook for stocks. Other factors include earnings, the Biden administration’s initiatives and valuations.
In this week’s special question, we asked AAII members to share how spring’s volatility in the Nasdaq composite affected their outlook on the stock market.
More than half of respondents (53%) say that they felt indifferent about the volatility and still had a neutral outlook on the market. Many within this group also say that day-to-day volatility is to be expected and they are focused on investing for the long term. This compares to 14% of respondents who say that they view the recent volatility as a negative indicator, pointing to increased uncertainty and an impending market decline. In addition, about 16% of respondents say that they feel relatively concerned about the volatility, with some beginning to move out of particular stocks. About 9% of respondents say that they had a positive outlook, as the volatility presented new opportunities in the stock market.
Here is a sampling of the responses:
- “It has not affected my outlook. I expect volatility and can use some of it to my advantage.”
- “Volatility typically warns of a change in direction of the market’s price level—in this case pointing to a decline.”
- “Moved out of Nasdaq stocks and into value stocks.”
- “Just more opportunity to find a well-priced tech stock.”
- “As a long-term investor, I try to ignore short-term volatility. It does tend to reinforce my feeling that the market is very ‘toppy.’”
Bullish: 44.1%, up 7.6 points
Neutral: 36.2%, down 1.0 points
Bearish: 19.8%, down 6.7 points
Bullish: 38.0%
Neutral: 31.5%
Bearish: 30.5%
See more Sentiment Survey results.

AAII Asset Allocation Survey
Individual investors’ exposure to equities remained above 70% for the third consecutive month according to the latest AAII Asset Allocation Survey. Fixed-income allocations, however, declined to its lowest level since October 2018.
Stock and stock fund allocations increased by 0.2 percentage points to 70.5%, marking the 12th consecutive month that equity allocations are above the historical average of 61.0%. Equity allocations were last higher in January 2018 (71.2%).
Bond and bond fund allocations pulled back by 0.7 percentage points to 14.4%, staying below their historical average of 16.0% for the third consecutive month. Fixed-income allocations were last lower in October 2018 (13.3%).
Cash allocations increased by 0.5 percentage points to 15.1%. May was the 13th consecutive month cash allocations have been below their historical average of 23.0%.
Equity allocations continue to stay at an unusually high level. Optimism about the short-term direction of the stock market diminished last month but pessimism also was also below average in the weekly AAII Sentiment Survey.
Fixed-income allocations are still within their typical historical range. Concerns about inflation and rising equity prices are likely both playing a role in reducing exposure to bonds and bond funds.
- Stocks and Stock Funds: 70.5%, up 0.2 percentage points
- Bonds and Bond Funds: 14.4%, down 0.7 percentage points
- Cash: 15.1%, up 0.5 percentage points
- Stocks: 31.3%, down 0.1 percentage points
- Stocks Funds: 39.1%, up 0.3 percentage points
- Bonds: 2.2%, down 0.2 percentage points
- Bond Funds: 12.2%, down 0.4 percentage points
- Stocks/Stock Funds: 62.0%
- Bonds/Bond Funds: 16.0%
- Cash: 22.0%
Take the Asset Allocation Survey.
May 27, 2021 Creating Watchlists to Track Investing Ideas
May 20, 2021 More Buybacks and Bigger Dividends
May 13, 2021 Inflationary Signals Continue to Point Upward
May 6, 2021 Financial Problems Can Foreshadow Alzheimer's Disease

Discussion
Laury Adams from TX posted over 5 years ago:
Instead of an individual investor trying to rebalance a portfolio, what would happen if that person invested in a top performing No Loan Asset Allocation fund (60/40) like Fidelity Balanced or Puritan or Vanguard's Star? A cash reserve to supplement living expenses could be kept at either of these companies for ease of financial management.
Kevin from NC posted over 5 years ago:
I always thought the 4% withdrawal included extra management fees. When I was considering using an advisor, I thought the 1% AUM fee was essentially taking 25% of my yearly withdrawal. I consider this price much too high for the services rendered - it is even higher than my effective tax rate. And when I ran scenarios at 5% (4% withdrawal plus AUM fee), they seldom survived 30 years.
Greg from TN posted over 5 years ago:
I'm perplexed. If one withdraws 4% each year (ignoring inflation), I would think the account balance would never reach zero as one is removing a percentage of the account. Additionally, this study and article point out the sensitivity of outcomes to the particular time period selected for the analysis. Finally, it seems to me that the oddness of today's investment period (interest rates = zero) is glancingly acknowledged but not addressed. From a practical standpoint, why bother with bonds (except for ibonds)? Many thanks for another stimulating article.
John Lambert from NJ posted over 5 years ago:
In 2000, the stock market, by almost any valuation measure, was grossly overvalued. The 4% rule was created using historical data which did not include 2000. The worst year to retire in Bengen's study and for which the 4% rule just worked was 1966. The 1966 retiree's portfolio lasted 30 years. Had this retiree lived one more year he would have died in poverty. The weakness of any simple rule based on history is that the worst conditions in the past may be exceeded in the future. It is like the flood that exceeds the previous biggest flood recorded 100 years ago and breaches the flood control levees.
You need to log in as a registered AAII user before commenting.
Create an account