

Small-Cap Stocks Are Cheap Relative to Large-Cap Stocks
by Charles Rotblut | October 28, 2021
Small-cap stocks remain cheaper than usual relative to large-cap stocks. We’re seeing this relative undervaluation exist across valuation ratios.
I’ll start the comparison with the price-to-book-value (P/B) ratio. This is a valuation comparison that AAII president John Bajkowski has discussed in the AAII Journal, and I’m using his data here. Currently (as of October 2021), the median price-to-book ratio for S&P SmallCap 600 index stocks is 2.22. For large-cap S&P 500 index stocks, the median price-to-book ratio is 4.11. Dividing 4.11 by 2.22 gives us a relative price-to-book valuation of 1.85.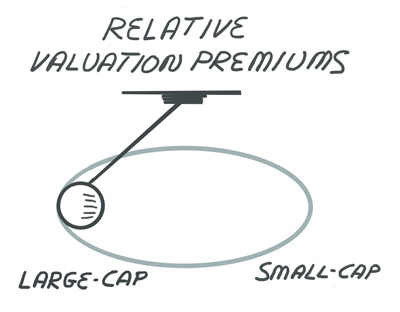
This relative valuation is above the historical average of 1.54 and the historical median of 1.49. Larger numbers reflect higher valuations for large-cap stocks relative to small-cap stocks. The data used dates back to December 1998.
Many investors prefer to look at the price-earnings (P/E) ratio. The median price-earnings ratio for large-cap stocks is 27.7. Small-cap stocks have a median price-earnings ratio of 20.1. The current relative price-earnings valuation of 1.38 is above the historical average and median valuations of 1.05 and 0.99, respectively.
The price-to-sales (P/S) ratio tells a similar story. The median price-to-sales ratio for large-cap stocks is 3.63. Small-cap stocks have a median price-to-sales ratio of 1.82. The current relative price-to-sales valuation of 1.99 is above the historical average and median valuations of 1.53 and 1.46, respectively.
The valuation premium assigned to large-cap stocks relative to small-cap stocks widened between 2016 and 2019. The exact year depends on the ratio used. Suffice it to say, the valuation pendulum has swung far in one direction.
Over time, the proverbial financial market pendulums swing back toward the center. It’s a concept known as reversion to the mean. In the process, these symbolic pendulums can overcorrect.
The timing of when reversion to the mean will occur and the magnitude by which it corrects is unknown. When Financial Metrics do swing back toward their historical averages, the corrections are often painful for those who are caught off guard by them. Veterans in the financial industry and those who study market history are familiar with the past occurrences.
Unless a permanent break from history has occurred, it is reasonable to expect the relative valuation gap to close in the future. We saw small-cap stocks outperform earlier this year before lagging large-cap stocks starting around July. Whether the first half of the year was the beginning move or just a short-term blip in an ongoing trend that has yet to exhaust itself remains to be seen. What we do know is that relative valuations continue to favor smaller- over larger-capitalization stocks.


- How big of an allocation should you have to small-cap stocks? A market weight is a starting point, but a larger allocation can be justified, as this 2014 AAII Journal article explains.
- Small-cap stocks tend to outperform during periods of economic expansion.
- For those of you who want to go a little bit larger in size, this month’s AAII Journal highlights mid-cap mutual funds and mid-cap ETFs with strong and consistent relative performance.
- Halloween will take place on Sunday. To help you get through the ghastly night, Derek Hageman has put together a list of sweet and savory stocks for your portfolio.
- We just added a new lesson about time horizons and goals in our PRISM Academy. AAII assistant editor Anine Sus discusses index funds on her My Investing Discoveries blog.
AAII Sentiment Survey
The results from the latest AAII Sentiment Survey shows optimism pulling back following last week’s big rise. In addition, the percentages of investors describing their outlook for stocks as “neutral” and “bearish” both increased.
Bullish sentiment, expectations that stock prices will rise over the next six months, fell 7.1 percentage points to 39.8%. However, given that last week’s reading was the highest since July 1, 2021, optimism remains above the historical average of 38.0%.
Neutral sentiment, expectations that stock prices will stay essentially unchanged over the next six months, rebounded by 5.3 percentage points to 30.7%. This is the seventh time in 10 weeks that neutral sentiment is below its historical average of 31.5%.
Bearish sentiment, expectations that stock prices will fall over the next six months, increased by 1.6 percentage points to 29.4%. This is the first time pessimism is below its historical average of 30.5% on consecutive weeks since July 2021.
The return to normalcy from the coronavirus pandemic, monetary and fiscal stimulus and inflationary pressures are influencing individual investors’ outlook for stocks. Other factors include earnings, valuations and the Biden administration’s initiatives.
In this week’s special question, we asked AAII members to share which sectors or industries they favor right now. Many respondents listed more than one sector or industry.
One in five respondents (20%) view financial sector stocks as being attractive right now. About 18% of respondents cite the energy sector. This compares to 13% of respondents who mention the technology sector. Coming in fourth were consumer cyclicals (12%). Other sectors and industries mentioned included health care (9%), basic materials (7%) and transportation (4%).
Bullish: 39.8%, down 7.1 points
Neutral: 30.7%, up 5.4 points
Bearish: 29.4%, up 1.7 points
Bullish: 38.0%
Neutral: 31.5%
Bearish: 30.5%
See more Sentiment Survey results.

October 21, 2021 Don't Judge a Bitcoin ETF by Its Name
October 14, 2021 Two New AAII Member Benefits
October 7, 2021 Seven Pitfalls Dividend Investors Should Avoid
September 30, 2021 Automate Retirement Savings and Retirement

Discussion
Rob from NC posted over 4 years ago:
Excellent article. This sort of information is why I'm an AAII member!
JohnLB from Fla posted over 4 years ago:
Rob, I’m right there with you! As a lifetime member of AAII, I could not imagine investing long term without their assistance. They make it possible for someone like me to be an investor, rather than a speculator!
Hap from OR posted over 4 years ago:
Thanks for the insight. These trends provide good foundational information for longer term actions in the market. It would be interesting to slice the S&P by taking out the FAANG stocks, which represent somewhere over 26% of the total weighting and have much higher P/S, P/E, and P/Bk ratios, to calculate a "trimmed median" set of ratios. This might give some more representative context to the historical values in the chart provided.
Barry from Texas posted over 4 years ago:
Good article. Good data and analysis. However, this may be the 10th or so article I have received on the relative value of small cap stocks as a hedge against inflation from the investment services I follow. That suggests to me that the train has already left the station. It is likely that some of the other subscribers have become new small-cap buyers, raising the price (the numerator in all 3 ratios) thus closing the relative spread and undermining the logic of this article. As the historical data also shows, small caps are a good long-term investment as part of a balanced portfolio since. That was Paul Merriman's recommendation in a recent AAII Conference article. He also used the same ratios to make his argument. Clue Tex Beneke, "Pardon me boy, is that ... "
Barry from Texas posted over 4 years ago:
Good article. Good data and analysis. However, this may be the 10th or so article I have received on the relative value of small cap stocks as a hedge against inflation from the investment services I follow. That suggests to me that the train has already left the station. It is likely that some of the other subscribers have become new small-cap buyers, raising the price (the numerator in all 3 ratios) thus closing the relative spread and undermining the logic of this article. As the historical data also shows, small caps are a good long-term investment as part of a balanced portfolio since. That was Paul Merriman's recommendation in a recent AAII Conference article. He also used the same ratios to make his argument. Clue Tex Beneke, "Pardon me boy, is that ... "
You need to log in as a registered AAII user before commenting.
Create an account