

A Sign of Light for Value Investors
by Charles Rotblut | February 03, 2022
Featured Tickers: FB
NFLX
FB
NFLX
While gathering data for a webinar I will be giving next week, something caught my eye—the recent outperformance of stocks with low price-to-book (P/B) ratios relative to stocks with high price-to-book ratios. Though just one data point, it could be another sign of light for value investors who have been patiently waiting to get to the end of the current value drought.
The observation came from an analysis of data in Dartmouth professor Kenneth French’s online data library. During the past four years, an equal-weighted portfolio of stocks with low price-to-book ratios (“value stocks”) realized annualized returns of 17.1%. A similar portfolio of stocks with high price-to-book ratios (“growth stocks”) realized annualized returns of 16.1% over the same period. 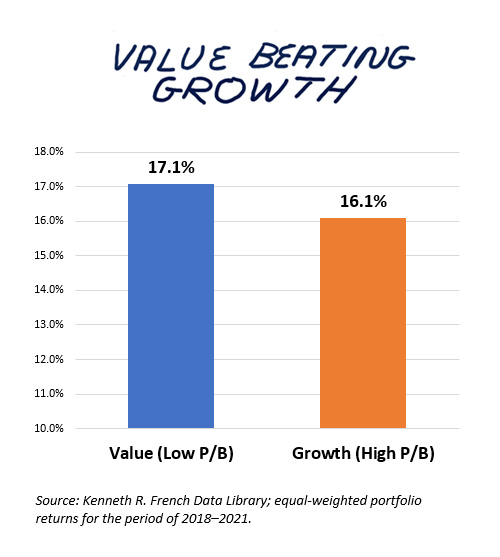
Growth stocks still had the edge when price-earnings (P/E) and price-to-cash-flow (P/CF) ratios were used instead. When defined by high and low price-earnings ratios, growth stocks gained 17.9% while value stocks gained 13.2%. When portfolios were created by using high and low price-to-cash-flow ratios, growth stocks returned 17.1% while value stocks returned 14.5%.
Four years is a short period of time to judge the performance of factors like value. I used this period of time to see how the value factor has performed since we launched VMQ Stocks at the start of 2018. This strategy seeks to identify stocks at the intersection of the value, momentum and quality factors. We encourage investors to look at longer periods of time because over shorter periods any strategy can be in or out of favor. (A factor is a quantitative characteristic associated with higher returns.)
The long-term data strongly favors value. Since 1952, an equal-weighted portfolio of stocks with low price-to-book ratios has realized an annualized return of 17.8% versus just 9.1% for a similar portfolio of growth stocks. For the price-earnings ratio, the returns are 17.6% for value versus 11.4% for growth. When price-to-cash flow is used, the comparative returns are 18.0% versus just 11.0%. Those are big differences.
Value, like other factors, goes through bouts of underperformance. It was a particular laggard over the latter half of the last decade. During the five-year period of 2016 to 2020, value underperformed growth on the basis of the price-to-book (5.1% versus 8.2%), price-earnings (4.8% versus 7.7%) and price-to-cash-flow (5.5% versus 8.0%) ratios. This underperformance occurred during a period when large technology and e-commerce companies were favored. Investors willingly paid up for these stocks’ prospects of being long-term leaders in the digital economy.
Growth is a good thing. As value investors, we just believe investors shouldn’t overpay for growth. The higher the premium, the more room there is for disappointment. We’ve seen this play out with Netflix Inc.  (NFLX) over the past several trading days and with Meta Platforms Inc. (FB) today.
As to where to draw the line, the numbers I used were based on portfolios with stocks whose valuations ranked in the cheapest and most expensive 30%. Here’s where the absolute valuation ratios fall:
- Price-to-Book: 1.28 and 3.20
- Price-Earnings: 11.1 and 28.3
- Price-to-Cash Flow: 5.8 and 42.6

- Though value investing can require patience at times, it can be very rewarding. This 2013 AAII Journal article has timeless tips from some of the world’s great value investors.
- The February AAII Journal is now online. It includes our updated mutual fund guide and ETF guide.
- We’ll be hosting two live webinars next week. Wayne Thorp will show you how to use our Stock Investor Pro program to identify great stocks on Monday. Then on Wednesday, I will discuss the VMQ Stocks strategy for identifying stocks with strong value, momentum and quality traits.
- The types of investment accounts you have, as well as certain constraints, may impact how your portfolio is managed. In PRISM Academy, we discuss how the types of accounts you have and how much time you have to manage your portfolio will play major roles in who you select to manage your investments.
AAII Sentiment Survey
The results from the latest AAII Sentiment Survey show pessimism remaining unusually high and optimism remaining unusually low. In addition, the percentage of individual investors who described their outlook for stocks as “neutral” increased.
Bullish sentiment, expectations that stock prices will rise over the next six months, increased 3.4 percentage points to 26.5%. Nonetheless, optimism remains well below its historical average of 38.0%. Bullish sentiment levels are also unusually low for the fourth consecutive week. This is the first time this has happened since the four-week period of June 17 to July 8, 2020.
Neutral sentiment, expectations that stock prices will stay essentially unchanged over the next six months, jumped by 5.9 percentage points to 29.9%. The historical average is 31.5%.
Bearish sentiment, expectations that stock prices will fall over the next six months, decreased by 9.3 percentage points to 43.7%. This is bearish sentiment’s 11th consecutive week above its historical average of 30.5% and its third consecutive week at an unusually high level.
Historically, the S&P 500 index has gone on to realize above-average and above-median returns during the six- and 12-month periods following an unusually low reading for bullish sentiment. Six-month returns following an unusually high bearish sentiment reading have also tended to be above-average and above-median.
Inflation, interest rates, the coronavirus pandemic and politics are all influencing individual investors’ outlook for stocks. Other factors include the economy and corporate earnings. The ongoing volatility in the stock market is likely also playing a role.
The return to normalcy from the coronavirus pandemic, monetary and fiscal stimulus and inflationary pressures are influencing individual investors’ outlook for stocks. Other factors include earnings, valuations and the Biden administration’s initiatives.
Bullish: 26.5%, up 3.4 points
Neutral: 29.9%, up 5.9 points
Bearish: 43.7%, down 9.3 points
Bullish: 38.0%
Neutral: 31.5%
Bearish: 30.5%
See more Sentiment Survey results.

AAII Asset Allocation Survey
Cash allocations among individual investors reached their highest level since February 2021 according to the January Allocation Survey. The latest survey also shows a decline in fixed-income and equity exposure.
Stock and stock fund allocations decreased by 0.9 percentage points to 69.6%. Equity exposure was last lower in February 2021 (67.7%). January marked the 20th consecutive month AAII members’ exposure to equities was above the historical average of 61.0%.
Bond and bond fund allocations fell by 0.1 percentage points to 14.3%. Fixed-income exposure was last lower in October 2018 (13.3%). The decline keeps fixed-income exposure below its historical average of 16.0% for the 11th consecutive month.
Cash allocations grew by 1.0 percentage points to 16.1%. Cash allocations were last higher in February 2021 (16.3%). Nonetheless, last month was the 21st consecutive month that cash allocations have been below their historical average of 23.0%.
Equity allocations remain at an unusually high level (above 69%). The major indexes all fell below their 200-day moving averages in January, with this decrease beginning on January 4, 2022. The Federal Reserve pointed to an interest rate hike coming in March to attempt to curb the rampant inflation, which is now above 7%.
At the same time, optimism among individual investors about the short-term direction of the stock market reached its lowest level of 21.0% since July 2020 (20.2%) during the second-to-last week of January. Pessimism in our weekly AAII Sentiment Survey jumped to 46.7% late in the month and was also last higher in July 2020 (46.8%).
- Stocks and Stock Funds: 69.6%, down 0.9 percentage points
- Bonds and Bond Funds: 14.3%, down 0.1 percentage points
- Cash: 16.1%, up 1.0 percentage points
- Stocks: 32.8%, down 0.4 percentage points
- Stocks Funds: 36.8%, down 0.5 percentage points
- Bonds: 2.2%, up 0.3 percentage points
- Bond Funds: 12.1%, down 0.4 percentage points
- Stocks/Stock Funds: 62.0%
- Bonds/Bond Funds: 16.0%
- Cash: 22.0%
Take the Asset Allocation Survey.
January 27, 2022 Smart Investing Steps You Can Take During the Current Bout of Volatility
January 20, 2022 Portfolio Allocations Often Do Not Follow Shifts in Sentiment
January 13, 2022 Seven Dividend Warning Signs to Watch Out For
January 6, 2022 2022 Brings New Life Expectancy Tables for Calculating RMDs

Discussion
Keith from MA posted over 4 years ago:
Excellent article pointing out longer term Value's virtues, however your last paragraph siting Growth failures based on single days of performance is no point at all.
John L from NJ posted over 4 years ago:
AAII is very fortunate that Charles is satisfied with being an editor and educator instead of using his VMQ expertise to start a hedge fund.
Jim S from IL posted over 4 years ago:
I agree that AAII is fortunate to have Charles. Nonetheless, I'm not sure that most hedge-fund investors would be willing to stick with an approach that, since its inception, has significantly underperformed its chosen benchmark index. (Full disclosure: I have been a VMQ subscriber/investor since that portfolio's inception >4 years ago---and I currently have no intention of abandoning it).
Josh D from PA posted over 4 years ago:
I'd be curious to see how my latest value buy ranks in VMQ: P/B 0.48 and PE <5 stock is Unum Group (UNM). Fundamentals suggest book value and earnings uptrend going forward.
You need to log in as a registered AAII user before commenting.
Create an account