

2022 Brings New Life Expectancy Tables for Calculating RMDs
by Charles Rotblut | January 06, 2022
How much retirees are required to withdraw from traditional IRAs, SEP IRAs and SIMPLE IRAs; 401(k), 403(b) and 457 plan accounts; and Roth 401(k) accounts changed at the start of this year. New life expectancy tables went into effect as of January 1, 2022. These tables determine the required minimum distribution (RMD) a retiree must take on an annual basis after they reach age 72, or 70½ if born prior to July 1, 1949. (Different distribution rules apply to inherited IRAs; Roth IRAs are exempt from mandatory withdrawals.)
The changes to the life expectancy tables, which were proposed in 2019, were made because people are living longer. The previous tables used for determining RMDs were developed in 2002 using mortality rates for 2003. An executive order in 2018 required the Treasury Department to determine if the tables should be revised.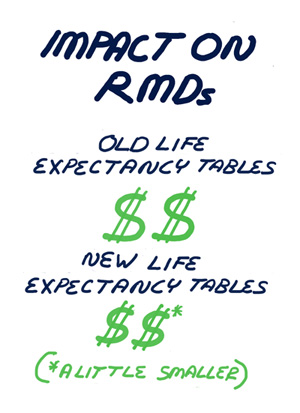
The new Uniform Lifetime Table assigns a life expectancy of 27.4 years to a 72-year-old IRA owner to calculate RMDs. Last year, a 72-year-old’s RMD would have been calculated using a life expectancy of 25.6 years. You can see the revised tables in the Federal Register. (As of this morning, the IRS had yet to publish an updated version of Publication 590 with the new tables.)
How much of a difference does this make? Let’s run the numbers on a $1 million retirement account using an example given in the Federal Register. The math is simply the retirement account value divided by the applicable life expectancy (aka distribution period). Under the new Uniform Lifetime Table, the RMD for this year would be $36,496. Had this retiree reached age 72 last year, their RMD would have been $39,063. This year’s RMD is 6.6% smaller for a retiree in the same age bracket and with the same account size.
Another example from the Federal Register shows how the change differs depending on age and the table used. A 75-year-old using the Single Life Table will use a life expectancy of 14.8 years. Their RMD for this year will be $67,568. Last year, a 75-year-old would have used a life expectancy of 13.4 years, resulting in an RMD of $74,627. The difference between the two is 9.5%.
Three things impact the RMD calculation: the retirement account’s year-end balance, the account owner’s age and the life expectancy table used. Thus, while apples-to-apples examples are helpful for demonstrating the impact of the change, the amount by which each retiree’s RMD will change this year relative to last year will differ.
RMDs are calculated individually for each retirement account subject to the mandatory distributions. (Most brokers and mutual fund companies automatically do the calculations.) If a person owns more than one IRA, they can aggregate the RMD amounts and withdraw the cumulative total from one IRA. RMDs from 401(k) and similar workplace accounts must be taken separately from each account. RMDs for 403(b) tax-sheltered annuity accounts should be combined. See the IRS’ RMD Comparison Chart for more information.

- Qualified charitable distributions offset RMDs from IRAs dollar-for-dollar up to $100,000 per year.
- The January AAII Journal is now live on AAII.com.
- This month’s First Cut article identifies the stocks passing the most AAII Screens.
- We have two webinars scheduled for the coming week. Monday will feature a rebroadcast of Wayne Thorp’s AAII Platinum open house. On Thursday, in a live webinar, I’ll offer guidelines for selecting the right allocation strategy for your goals.
AAII Sentiment Survey
The percentages of individual investors expecting stocks to stay unchanged or decline over the next six months both rebounded in the latest AAII Sentiment Survey.
Bullish sentiment, expectations that stock prices will rise over the next six months, pulled back by 4.9 percentage points to 32.8%. Optimism remains below its historical average of 38.0% for the seventh consecutive week.
Neutral sentiment, expectations that stock prices will be unchanged over the next six months, rose 2.1 percentage points to 33.9%. Neutral sentiment is above its historical average of 31.5% for the fifth consecutive week.
Bearish sentiment, expectations that stock prices will fall over the next six months, rose 2.8 percentage points to 33.3%. Pessimism extended its streak of being at or above its historical average of 30.5% to seven consecutive weeks.
All three indicators are within their typical historical ranges
Most of the responses to this week’s survey were recorded prior to yesterday’s drop in the major market indexes.
Progress toward returning to normalcy from the coronavirus pandemic, monetary and fiscal stimulus and inflationary pressures also continue to influence individual investors’ outlook for stocks. The omicron variant of the coronavirus may also be playing a role. Additional factors include earnings, valuations and the Biden administration’s initiatives.
This week’s special question asked AAII members how big of a percentage gain or loss the S&P 500 index will realize in 2022. Nearly two-thirds of respondents (66%) expect to see returns greater than 2%, with 43% expecting to see returns between 6% and 15% for 2022.
Conversely, about 26% of respondents expect to see negative returns greater than 2%, with 19% predicting losses to exceed 10%. Roughly 8% of respondents predict that the returns will be flat for 2022 (between –1% and 1%).
Here is a sampling of the responses:
- I think the S&P 500 will be up over 10% this year as current fears about inflation, the coronavirus and the midterm elections fade during the year.
- Inflation, the coronavirus, supply chain, energy and government policy will lead to a double-digit loss for the S&P 500.
- I think we’ll probably end flat-to-down (–1% to –3%) in 2022. I expect earnings to still be strong, but the health and interest rate environment look to be more uncertain or even negative. I look for a strong first half and a much weaker second half.
- The Fed tapering and raising rates three times in 2022 will cause the S&P 500 to lose about 5% to 10%.
- I think we’ll see a 20% gain in the S&P 500.
- Single-digit percentages. The big tech companies have gotten ahead of themselves (just like the little tech companies) but, they have been held up because of their place in the indexes and ETFs.
Bullish: 32.8%, down 4.9 points
Neutral: 33.9%, up 2.1 points
Bearish: 33.3%, up 2.8 points
Bullish: 38.0%
Neutral: 31.5%
Bearish: 30.5%
See more Sentiment Survey results.

AAII Asset Allocation Survey
Individual investors’ exposure to cash rebounded to 15.1% for the month of December. The increase was offset by a corresponding decrease in equity exposure according to the latest AAII Asset Allocation Survey.
Stock and stock fund allocations decreased by 0.9 percentage points to 70.5%. The drop solely reflected lower stock fund holdings. December marked both the 10th consecutive month that equity allocations were at or above 70% and the 19th consecutive month that AAII members’ exposure to equities was above the historical average of 61.0%.
Bond and bond fund allocations remained constant at 14.4%. This is a six-month low. Fixed-income exposure is below its historical average of 16.0% for the 10th consecutive month.
Cash allocations rose 0.9 percentage points to 15.1%. They were last higher in February 2021 (16.3%). December was the 20th consecutive month that cash allocations have been below the historical average of 23.0%.
Equity allocations remain at an unusually high level (above 69%). Stocks faced a dip during December but rebounded at the end of the month, sending the S&P 500 index and Dow Jones industrial average to new record highs. In 2021, the indexes continued their uptrend and set several new record highs.
Optimism among individual investors about the short-term direction of the stock market was below 30% for December until the final week, when bullish sentiment grew to 37.7%. However, bullish sentiment remained below the historical average of 38.0% for the duration of the month. Bearish sentiment jumped to 42.4% early in the month, rising above its historical average of 30.5% and staying above it for the duration of the month. Additionally, neutral sentiment remained above its historical average for the entirety of December.
- Stocks and Stock Funds: 70.5%, down 0.9 percentage points
- Bonds and Bond Funds: 14.4%, down 0.0 percentage points
- Cash: 15.1%, up 0.9 percentage points
- Stocks: 33.2%, up 0.0 percentage points
- Stocks Funds: 37.3%, down 0.9 percentage points
- Bonds: 1.9%, down 0.0 percentage points
- Bond Funds: 12.5%, up 0.0 percentage points
- Stocks/Stock Funds: 62.0%
- Bonds/Bond Funds: 16.0%
- Cash: 22.0%
Take the Asset Allocation Survey.
December 30, 2021 Eight Individual Investor New Year's Resolutions for 2022
December 23, 2021 Guidelines for Selecting an Allocation Strategy
December 16, 2021 The Size of Withdrawals Relative to Wealth Influences Risk Tolerance
December 9, 2021 Financial Goals and Time in the Market

Discussion
Tom Nied from Ohio posted over 4 years ago:
It may seem obvious, but take a minute to think about "the account owner’s age" used to calculate RMDs. Do you use your age on the date you calculate the end-of-year value of your taxable retirement accounts? Or do you use your age on the date you file your Federal tax return? Or do you use the age you reach sometime during the course of the year? Frankly, the first time I did the calculation of RMDs due for TY2022, I got it wrong. It wasn't until I saw how Vanguard calculated my RMD that I was able to backtrack and figure the correct amount for all my IRA accounts. The answer? Use the age you have attained by the end of this year for figuring your RMD for this year.
Tom Nied from Ohio posted over 4 years ago:
It may seem obvious, but take a minute to think about "the account owner’s age" used to calculate RMDs. Do you use your age on the date you calculate the end-of-year value of your taxable retirement accounts? Or do you use your age on the date you file your Federal tax return? Or do you use the age you reach sometime during the course of the year? Frankly, the first time I did the calculation of RMDs due for TY2022, I got it wrong. It wasn't until I saw how Vanguard calculated my RMD that I was able to backtrack and figure the correct amount for all my IRA accounts. The answer? Use the age you have attained by the end of this year for figuring your RMD for this year.
Rob from NC posted over 4 years ago:
Thank you for this, Charles. I'm hoping when the IRS gets around to revising Publication 590, you can tell us how to use the new tables for "grandfathered" (stretch) inherited IRAs. I think the correct procedure is to go back to the age you inherited the IRA and figure what your life expectancy would have been according to the new tables, then subtract from the revised life expectancy the number of years since the inheritance to obtain the new denominator for figuring the RMD. I would sure like to have confirmation that this is correct.
Barry J from Texas posted over 4 years ago:
Thank you, Charles, for the update. The brokerage that hosts my IRA calculated my 2022 RMD and made it available before 1/31/21 so I could plan for 2022. Nice. The IRA is self-managed using some of the valuable data and information made available to me through my AAII "lifetime" membership. Very nice. It amuses me that the Federal government provides me an "expiration date." I wonder if they will put my picture on milk cartons if I "disappear" before my heavenly RMD? There is no where to hide from "Mother Sam."
Richard from Indiana posted over 4 years ago:
1 comment and 1 question. First, I think Rob from NC is right about his inherited IRA assumption, ie that you refigure the original or initial RMD, but am not 100% sure about that. I can see that Vanguard appears to have done that on my inherited RMD calcs for 2022. Second, are RMDs required for 401-k's? I saw a recent AARP article that said that RMDs are required, with no qualifications, nuance or fine print exceptions. My understand is that they may be required, but that in most cases they are not. Can someone set me straight on this?
Rob from NC posted over 4 years ago:
Richard, I'm pretty sure RMDs are required for all 401ks, even Roth 401ks. That's one reason to roll a Roth 401k into a Roth IRA. Maybe Charles could confirm that.
Bill R. from Texas posted over 4 years ago:
The tables used to calculate RMDs actually have 2 columns of numbers: "Life Expectancy" and "Distribution Period (Years)". They are not the same. Charles's statement "The math is simply the retirement account value divided by the applicable life expectancy (aka distribution period)." is confusing. For example, for a person 72 years old, the Life Expectancy is now 17.2 years and the Distribution Period is 27.4 years. The RMD value is the previous year's end-of-year account value divided by the Distribution Period. Many brokerages have an online calculator that will calculate this for you.
DT from AZ posted over 4 years ago:
I too would like more information on how to calculate my 2022 rmd to include the one time resetting of beneficiary age based on irs change made in Nov 2020 for inherited ira's (with the stretch). Does anyone know if the large brokerage houses like CS or Fidelity include this in their inherited ira calculators for 2022? Charles Schwab tells they are using the new tables for regular ira but no one can answer if the inherited ira calculators reset my age based on the new tables. I am still awaiting a response from them. There is no notation on the inherited rmd calculator to say they will reset the age for 2022. Appreciated any feedback. Do you know of any rmd calculators for inherited iras include this reset for 2022?
You need to log in as a registered AAII user before commenting.
Create an account