

Financial Goals and Time in the Market
by Charles Rotblut | December 09, 2021
A core concept underlying long-term investing strategies is time in the market. Time in the market refers to maintaining exposure to equities instead of trying to time market moves. It is the antithesis of market timing, which calls for getting in and out of stocks based on expectations about what could happen.
Time in the market strategies are designed to take advantage of long-term compounding. Since 1926, large-cap stocks have realized an annualized return of 10.4%. Small-cap stocks have realized a 12.0% annualized return according to data from Duff & Phelps and updated by us for this year. 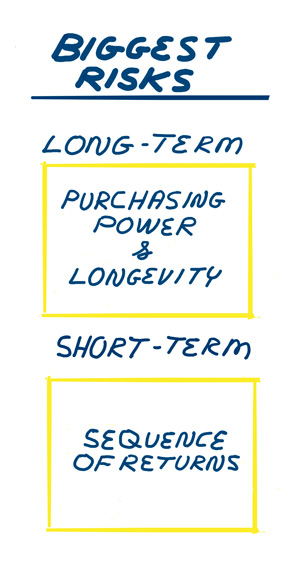
Granted, these great returns aren’t consistently realized. Between 1926 and 2020, large-cap stocks had negative calendar-year returns 26% of the time. Put another way, large-cap stocks fell in value at a frequency slightly higher than once every four years. Small-cap stocks fell in value nearly once out of every three years. The table below shows the frequency of losses. Avoiding such losses in real time is much harder to do than promoters of short-term trading strategies would have you believe.
Though these shorter-term drops can be psychologically and emotionally taxing for those with long investing horizons, they aren’t the biggest risk. The deterioration of future purchasing power (the ability to buy goods and services with the dollars you have) is a far bigger long-term risk. Longevity is the other very large risk for those whose main financial goal is funding retirement. (Longevity risk is the risk of outliving your savings.) Successfully fending off purchasing power risk and longevity risk requires time in the market with a significant allocation to stocks.
Downside volatility takes on far greater importance for those with short time horizons. An ill-timed series of bad returns (aka, sequence risk) can leave an investor without enough wealth to fund their goals. Sequence risk is particularly a concern for those who are intending to spend a proportionately large amount of wealth within a short period of time. Buying a house is a good example, especially in the current environment where offers may have to be raised to a would-be buyer’s upper limit. In such situations, a conservative allocation is warranted. (Those seeking to balance shorter-term withdrawals with longer-term investment horizons can strike a balance by holding both so-called “safe assets” to preserve capital and equities to grow capital.)
The Risk Tolerance Questionnaire in our PRISM Wealth-Building Process uses the timing of goals to help you determine the appropriate allocation for a given financial goal. We use the following periods:
- Short-term (five years or less)
- Intermediate (five to 10 years)
- Long-term (more than 10 years)
It can be helpful to view these from the standpoint of what is the greater risk based on your time frame. If the bigger risks are the deterioration of purchasing power and outliving your savings, emphasize time in the market by allocating heavily to equities. If the bigger risk is a bad sequence of returns, emphasize preservation of capital through an allocation to safer assets.
Odds of Losing Money
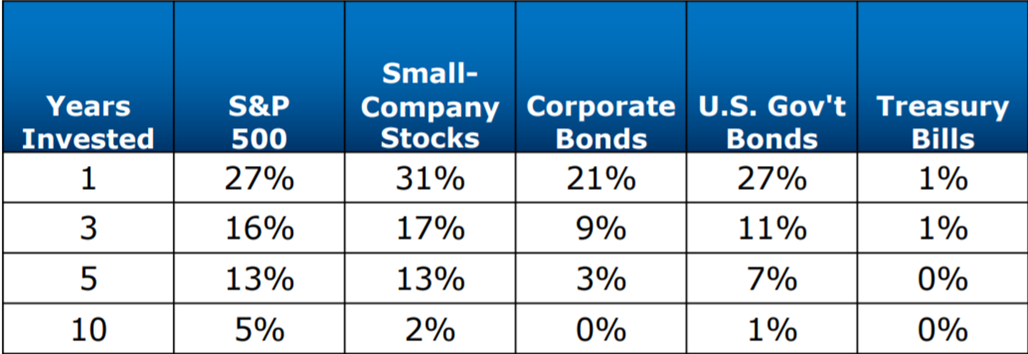
Source: Roger G. Ibbotson and Duff & Phelps, “2020 Stocks, Bonds, Bills, and Inflation Yearbook” (Duff & Phelps, 2020). Data from 1926 through 2019.

- For more on short-term versus long-term risk, watch the new video we just posted to our PRISM Wealth-Building Academy.
- I demonstrated how the sequence in which returns occur can lead to very different outcomes when withdrawals are taken in this May 2015 AAII Journal article.
- There is still time to make these smart tax moves before 2021 ends.
- Wayne Thorp will show off the enhancements we’ve made to A+ Investor, including our new online custom stock screener, this Wednesday.
AAII Sentiment Survey
The percentage of individual investors describing their short-term outlook for stocks as “neutral” is at its highest level in nearly two years. The latest AAII Sentiment Survey also shows a significant drop in bearish sentiment.
Bullish sentiment, expectations that stock prices will rise over the next six months, increased by 3.1 percentage points to 29.7%. This is the third consecutive week that bullish sentiment remains below the historical average of 38.0%.
Neutral sentiment, expectations that stock prices will stay essentially unchanged over the next six months, increased by 8.8% percentage points to 39.8%. Neutral sentiment was last higher on January 1, 2020 (40.9%). The historical average is 31.5%.
Bearish sentiment, expectations that stock prices will fall over the next six months, plunged by 11.9 percentage points to 30.5%. This week’s reading matches the historical average. The significant decline in bearish sentiment follows last week’s reading of 42.4%, which was the highest level since August 19, 2020.
The big moves in neutral and bearish sentiment occurred as the major indexes recouped much of the losses incurred when the new coronavirus omicron variant began spreading. The return to normalcy from the coronavirus pandemic, monetary and fiscal stimulus and inflationary pressures are also influencing individual investors’ outlook for stocks. Additional factors include earnings, valuations and the Biden administration’s initiatives.
In this week’s special question, we asked AAII members how the coronavirus pandemic, including the new omicron variant, is influencing their outlook for stock prices.
More than two of out five respondents (44%) say that they have a neutral outlook. Many respondents indicate that they are long-term investors and are not worried about factors such as coronavirus variants A negative, or bearish, outlook on stock prices is reported by 33% of respondents, mostly attributed to the volatility and fluctuating prices caused by the coronavirus and its variants. Conversely, 15% of respondents have a bullish, or positive, outlook, indicating that they feel the market is beginning to get used to pandemic-related volatility and variants.
Here is a sampling of the responses:
- “It is not influencing my investment decisions. It’s a short-term issue that’s already reflected in stock prices.”
- “In the medium term, the pandemic response is negative. The U.S. government has distributed much cash to us, which ought to be paid back via future taxes, and should reduce market returns.”
- “Positively. Progress fighting the pandemic will reduce uncertainty and boost confidence leading to more buying.”
Bullish: 29.7%, up 3.1 points
Neutral: 39.8%, up 8.8 points
Bearish: 30.5%, down 11.9 points
Bullish: 38.0%
Neutral: 31.5%
Bearish: 30.5%
See more Sentiment Survey results.

December 2, 2021 How You React to Volatility Matters
November 25, 2021 Reasons for Individual Investors to Be Grateful in 2021
November 18, 2021 The Tax Implications for Investors of Corporate Splits
November 11, 2021 Run Your Own Race: Investing as Marathon Training

Discussion
Rob from NC posted over 4 years ago:
All the more reason to go all in for equities early in life and stay 100% invested in stocks -- forever. That way, you don't have to play a lot of shell games with your assets. You don't have to waste money on anyone's "special" program or system. You don't have to "rebalance." You don't even have to try to "beat the market." In fact, you could invest in nothing but a single low-expense-ratio equity ETF all your life and come out ahead. Bogle is right about that. Couple this strategy with a 4% or 5% flat-rate withdrawal rule (no inflation adjustment -- let market values take care of that) in retirement and you'll never run out of money. I think the chart in this article fails to take inflation into account. I cannot imagine buying a 10-year corporate bond today and expecting a zero chance of losing money against inflation. Not in this environment! I opened Roth IRAs for my children as soon as they were old enough to earn a little money. I invested in a single, tech heavy, low-expense-ratio index ETF. If the value of each of their current Roths grows by 10% a year until they're 65, they'll each be a multimillionaire. Adding to those Roths each year and growing at the same rate will put them on easy street well before 65. There's no better Christmas present to give a child!
Bryan from TX posted over 4 years ago:
Is there a Part 2 to this article? I don't understand why loss of purchasing power and longevity risks are mentioned since only sequence risk is addressed in the article. Also missing, it seems to me, is a discussion of the magnitude of the risk. In any given year, does the 21% chance of losing money in corporate bonds equate to the same magnitude of loss as the 27% chance of losing money in the S&P? That is, by investing in corporate bonds am I running the risk of losing $100 21% of the time vs losing $500 27% of the time in the S&P vs losing $1 1% of the time in Treasuries? If so, that would slant the decision even more heavily in favor of Treasuries than the table would indicate. (And, it would pretty much reduce the conclusion of the article to "Well, Duh!") If we wanted to include consideration of the loss of purchasing power, it would be interesting to know at what inflation rate does the loss of purchasing power overcome the sequence risk? Using the home purchase example in the article, under what circumstance would you ever use the stock market as your savings vehicle for compiling your downpayment? If your home purchase is over 10 years in the future so you can risk "saving" in the market, that means saving enough for a downpayment is literally a generational project. If that is so, can you really expect to be able to pay the ongoing mortgage payments once you do have the downpayment assembled in that scenario? Unless, of course, the loss of purchasing power is so great that you have no choice but to risk the market in an attempt to preserve your purchasing power as you save. At that point, would we not need to also consider holding a non-financial asset (i.e., a non-perishable commodity such as gold) in our attempt to preserve purchasing power against such raging inflation?
You need to log in as a registered AAII user before commenting.
Create an account