

The Tax Implications for Investors of Corporate Splits
by Charles Rotblut | November 18, 2021
Featured Tickers: GE
IBM
JNJ
GE
IBM
JNJ
TOSYY
It used to be that bigger was better. Now, the emerging trend among corporate conglomerates is to split into smaller companies. General Electric Co.  (GE), Johnson & Johnson (JNJ) and Toshiba Corp. (TOSYY) all announced their intentions break up into small companies last week. Earlier this year, IBM Corp. (IBM) announced its intention to get smaller.
Executives believe splitting their companies up will give their various business units a better opportunity to thrive. Investment bankers see an opportunity to earn more fees. Individual investors could face more tax complexity.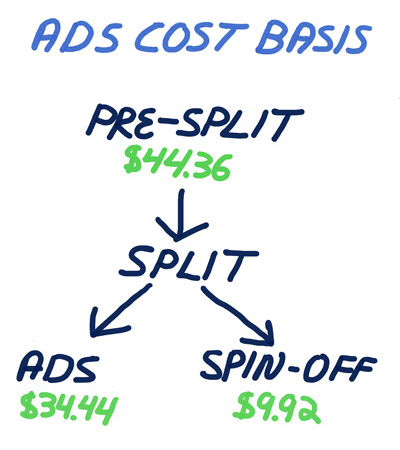
The latter would be the case for those holding shares in a taxable account of a company intending to split itself up. When a split occurs, the cost basis gets adjusted accordingly. The cost basis is the price at which the stock was acquired. I’m going to share an example that Wayne Thorp recently wrote for our Stock Superstars Report (SSR) to demonstrate how it works.
Before I do, I want to address cost-basis reporting. Brokers are required to report cost basis for stocks purchased on or after January 1, 2011. Cost basis is required to be reported for shares acquired through a dividend reinvestment plan (DRP) on or after January 1, 2012. Given the market capitalization and long histories of General Electric, IBM and Johnson & Johnson, it is very possible for some investors to have purchased shares of these stocks prior to 2011. Anyone falling into this category may have to do the adjusted cost basis calculations themselves.
The rule of thumb for adjusting cost basis is that the price paid for the original stock is proportionately split among the shares of the parent company and the shares of the spin-off company, based on the value of each stock.
An Example of Cost-Basis Allocation Following a Spin-Off
Last week, Stock Superstars Report holding Alliance Data Systems Corp. (ADS) completed the separation of its LoyaltyOne segment into an independent, publicly traded company—Loyalty Ventures Inc. (LYLT). Here’s a summary of how Thorp determined the cost basis.
According to Alliance Data, the separation was achieved through the pro-rata distribution after the market close on November 5, 2021, of 81% of the outstanding shares of Loyalty Ventures to holders of Alliance Data common stock, with Alliance Data stockholders receiving one share of Loyalty Ventures common stock for every 2.5 shares of Alliance Data common stock held at the close of business on October 27, 2021. Any fractional shares resulting from the transactions were to be sold in the open market on the shareholder’s behalf, with the shareholder receiving a cash payment for the fractional share based on its pro-rata portion of the net cash proceeds from all sales of fractional shares.
Within the SSR tracking portfolio, 152 shares of Alliance Data are owned. Based on the announced distribution ratio of one share of Loyalty Ventures stock for every 2.5 shares of Alliance Data, the SSR portfolio was entitled to 60.8 shares of Loyalty Ventures. But since fractional shares were not distributed, we received 60 shares of Loyalty Ventures plus cash in lieu of fractional shares.
Often, companies issue explicit information on how shareholders adjust the cost basis to account for spin-offs. However, this information was not provided. Rather, Alliance Data’s investor relations department referred us to a regulatory statement lacking detail to determine the cost basis.
However, TD Ameritrade, the broker we use for managing the SSR tracking portfolio, adjusted the cost basis of the Alliance Data shares. Alliance Data was added to the SSR portfolio on August 3, 2020, at an average cost of $44.36 (pre-adjusted). TD Ameritrade shows the SSR adjusted cost basis for the Alliance Data shares as $34.4402. This translates into an adjustment factor of 1.288 (44.36 ÷ 34.4402). The remaining cost basis amount of approximately $10 per share is the cost basis of the new Loyalty Ventures shares—including any amount received for the fractional shares sold.
On the close of November 5, the last trading day before the Loyalty Ventures spin-off, Alliance Data shares closed at $91.67. This means the SSR Alliance Data position of 152 shares was worth $13,933.84. On the close of November 8, the first day of trading after the Loyalty Ventures shares were distributed and the price of Alliance Data shares were adjusted, Alliance Data shares closed at $74.76 and Loyalty Ventures shares closed at $49.08. This means the SSR portfolio’s total stock position value was (152 × $74.76) + (60 × $49.08) or $14,308.32. In addition, on November 10, the portfolio received $29.88 in cash in lieu of the 0.80 fractional shares of Loyalty Ventures not distributed, bringing the total position value to $14,338.20.
Per the rules of the SSR portfolios, shares of Loyalty Ventures were sold. Investors following a different strategy may reach a different decision on whether to hold onto the stocks.

- To learn more about how to track cost basis following a merger, spilt or other corporate action, read this article in the AAII Journal archives.
- The rules regarding the reporting of cost basis can be found in our tax guide. An updated tax guide will be posted to AAII.com in two weeks.
- I had a great conversation with Robert Hagstrom about Warren Buffett and his evolving view of value. We published a transcript in the November AAII Journal.
- Our Buffett Hagstrom screen ranks among best-performing AAII stock screens in terms of long-term performance.
- We just added a brand-new video for Step 2, Recognize Your Risk Tolerance and Allocation, in our PRISM Wealth-Building Academy.
AAII Sentiment Survey
The results from the latest AAII Sentiment Survey saw bullish sentiment pull back from last week’s four-month high. Meanwhile neutral sentiment rose to its highest level in six weeks.
Bullish sentiment, expectations that stock prices will rise over the next six months, fell 9.2 percentage points to 38.8%. Even with the decline, optimism is above its historical average of 38.0% for the fifth consecutive week.
Neutral sentiment, expectations that stock prices will stay essentially unchanged over the next six months, increased by 5.9 percentage points to 33.9%. Neutral sentiment was last higher on October 7, 2021 (37.7%). The historical average is 31.5%.
Bearish sentiment, expectations that stock prices will fall over the next six months, increased by 3.2 percentage points to 27.2%. Nonetheless, pessimism is below its historical average of 30.5% for the fifth consecutive week.
At current levels, all three indicators are well within their typical historical ranges.
The record highs realized by the major indexes are having a mixed impact on individual investor sentiment, as the responses to this week’s special question show. Also influencing individual investors’ outlook for stocks is the continued return to normalcy from the coronavirus pandemic, monetary and fiscal stimulus and inflationary pressures. Other factors include earnings, valuations and the Biden administration’s initiatives.
In this week’s special question, we asked AAII members if they think record highs set by the major indexes are warranted.
Respondents were split. About 44% think that the record highs are unwarranted. They mention the bull run as being unrealistically long and the belief that inflation will be transitory as contributing to the highs. Conversely, 42% feel that the results are warranted given factors like low interest rates and people having excess cash on hand to put into the stock market. About 7% of respondents have mixed feelings about the record highs.
Here is a sampling of the responses:
- “No. The major indexes are responding to the belief that inflation will be transitory. At some point, reality will set in and the correction that is long overdue will occur. Depending upon how the Federal Reserve responds could turn the correction into a recession. It’s not if, but when.”
- “Yes, earnings and company profits continue to beat estimates on a regular basis.”
- “I expect the market to be bullish in the next couple of months, but to have some weakness after that. Overall, I think returns over the next six months are likely to be neutral.”
Bullish: 38.8%, down 9.2 points
Neutral: 33.9%, up 5.9 points
Bearish: 27.2%, up 3.2 points
Bullish: 38.0%
Neutral: 31.5%
Bearish: 30.5%
See more Sentiment Survey results.

November 11, 2021 Run Your Own Race: Investing as Marathon Training
November 4, 2021 Portfolio Reviews Can Often Lead to Doing Nothing
October 28, 2021 Small-Cap Stocks Are Cheap Relative to Large-Cap Stocks
October 21, 2021 Don't Judge a Bitcoin ETF by Its Name

Discussion
No comments have been added yet. Add your thoughts to the discussion!
You need to log in as a registered AAII user before commenting.
Create an account