

How You React to Volatility Matters
by Charles Rotblut | December 02, 2021
The omicron variant. Federal Reserve chairman Jerome Powell’s comments about accelerating the end of bond purchases. A 14.5% drop in the Russell 2000 index. A three-week, 21-percentage-point drop in bullish sentiment among AAII members.
Yup, volatility is back.
Volatility is often perceived as risk. Volatility, in terms of investing, refers to the fluctuation of returns. Nobody complains when volatility pushes up the price of the stocks, funds and other investments they own. It’s the drop in prices that prompts investors to reach for the bottle of Tums.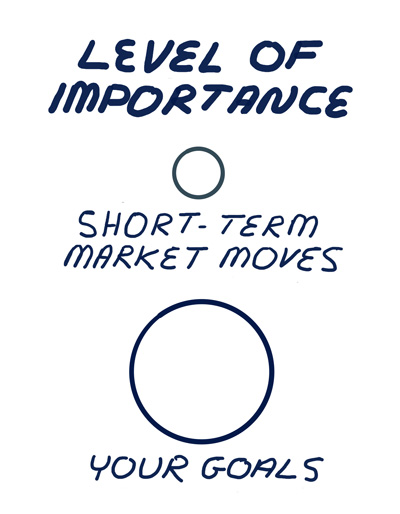
It just so happens that I’m currently explaining how to recognize your own tolerance for risk as part of Step 2 in our PRISM Wealth-Building Academy. From a financial standpoint, risk is the chance of not having the money available to spend at the time you need to spend it. From an investing standpoint, it is the likelihood of your portfolio being worth less than you could reasonably expect based on the investment strategy followed.
Many of you could point to the recent headlines as signs of risk. Yes, the new coronavirus variant appears to be more contagious. Yes, the Fed could overshoot (or undershoot) in its response to inflation. Yes, the drop in the small-cap Russell 2000 could be a harbinger of a broader market correction. But then again, exactly when did the proverbial wall of worries that stocks must climb—and sometimes slide down—not exist?
There are always issues Mr. Market must cope with. Sometimes, he shrugs them off. Sometimes, he paces back and forth while trying to decide what direction to move in next. Other times, he throws a tantrum. Investors are compensated for such changing behavior with long-term wealth-creating returns.
How you react to the short-term bouts of volatility—both upside and downside—plays a big role in determining how much of those long-term returns you will realize. The more you can align your investing decisions with your goals—which is what our PRISM Wealth-Building Process is designed to help you do—the more you will be able to maximize the returns you realize.
The PRISM process prompts you to think about your personal time horizon and both your financial and psychological ability not to react to headlines and associated market volatility. If no withdrawals are likely to be taken for several years (e.g., an older investor seeking to leave an inheritance or a millennial/Gen Z investor saving for retirement), maintaining a high allocation to equities is warranted. If withdrawals will be needed in the next few years (e.g., a large expense such as a down payment on a house, retirement living expenses, etc.), then an allocation to safe assets [savings accounts, certificates of deposit (CDs), etc.] is warranted. How much should be allocated to safe assets depends on the proportionate amount you will withdraw relative to your total wealth.
In the latter situation, the prerogative is to protect the amounts needed over the next few years against an ill-timed sequence of bad returns. In the former, long-term growth of wealth is the prerogative. This requires a realization that short-term volatility is a phantom risk for long-term investors who can psychologically withstand it. Failure to adhere to a well-thought-out and defined investment strategy poses a bigger threat than whatever events the daily headlines choose to focus on.

- I discuss the different components of risk in the newest video posted to our PRISM Wealth-Building Academy. As a reminder, the PRISM Academy is an AAII member benefit.
- In A Lifetime Investment Strategy, AAII founder James Cloonan described the downside volatility that many investors perceive as risk as becoming “unimportant as the holding period is lengthened.”
- The December AAII Journal, which includes our annual tax guide, is now online!
- One upside to the recent volatility is that it could give you the opportunity to take advantage of some tax-loss harvesting.
- Failing to be disciplined about saving is another risk investors face, as Anine Sus discusses in her latest My Investing Discoveries blog post.
AAII Sentiment Survey
The results from the latest AAII Sentiment Survey show a large increase in pessimism and corresponding large drop in optimism. Pessimism and optimism are now at unusually high and low levels, respectively.
Bullish sentiment, expectations that stock prices will rise over the next six months, fell 7.1 percentage points to 26.7%. Cumulatively, optimism has fallen by 21.3 percentage points over the recent three-week period. The historical average is 38.0%.
Neutral sentiment, expectations that stock prices will stay essentially unchanged over the next six months, increased by 0.5 percentage points to 31.0%. The historical average is 31.5%.
Bearish sentiment, expectations that stock prices will fall over the next six months, rose by 6.7% percentage points to 42.4%. Pessimism was last at this level on August 19, 2020 (42.4%). The historical average is 30.5%.
As noted above, bearish sentiment is now at an unusually high level and bullish sentiment is at an unusually low level. Historically, both have been followed by better-than-average and better-than-median returns for the S&P 500 index over the following six months.
The big shift in sentiment follows the emergence of the omicron variant, the possibility of an accelerated end to bond purchases by the Federal Reserve and the market’s reaction to both. Many AAII members are long-term investors and do not necessarily change their allocations in response to short-term events.
In this week’s special question, we asked AAII members how they thought the average consumer was faring relative to a year ago.
Four out of 10 respondents (40%) perceive the average consumer as being worse off. These respondents mention inflation and coronavirus variants as affecting their income and spending power. An additional 5% of respondents think consumers are much worse off than last year.
Conversely, 25% of respondents feel that consumers are better off than last year. They cite a stronger economy and more jobs being available. About 21% of respondents have mixed opinions on whether the consumer is doing better or not, acknowledging a stronger economy but also rising prices that detract from consumers’ income.
Here is a sampling of the responses:
- “Worse. Inflation is higher and fixed-income investors are losing to inflation and zero interest rates.”
- “Better. Because businesses are more open and vaccines are working.”
- “The average consumer is doing relatively well, with more cash on hand. This is offset somewhat by higher inflation, which has a disproportionate impact on consumers with lower incomes.”
- “Much worse than a year ago. Seeing a downward trend.”
Bullish: 26.7%, down 7.1 points
Neutral: 31.0%, up 0.5 points
Bearish: 42.4%, up 6.7 points
Bullish: 38.0%
Neutral: 31.5%
Bearish: 30.5%
See more Sentiment Survey results.

AAII Asset Allocation Survey
Equity allocations among individual investors reached their highest level in four years last month. The November Asset Allocation Survey also shows a small decline in fixed-income exposure.
Stock and stock fund allocations increased by 1.2 percentage points to 71.4% in the month. Equity exposure was last higher in December 2017 when allocations were at 72.0%. November also marked both the ninth consecutive month that equity allocations were at or above 70% and the 18th consecutive month that AAII members’ exposure to equities was above the historical average of 61.0%.
Bond and bond fund allocations pulled back by 0.7 percentage points to 14.4%. Fixed-income allocations were last at this level in May. The decline keeps fixed-income exposure below its historical average of 16.0% for the ninth consecutive month.
Cash allocations fell by 0.5 percentage points to 14.2%. They were last lower in August (13.7%). November was the 19th consecutive month that cash allocations have been below their historical average of 23.0%.
Equity allocations remain at an unusually high level (above 69%). Stocks rebounded throughout November, sending the S&P 500 index to new record highs, until the last week when the coronavirus omicron variant was discovered and Federal Reserve chair Jerome Powell announced the possibility of accelerating the tapering of debt purchases.
Optimism among individual investors about the short-term direction of the stock market reached its highest level since April (48%) during the second week of November, before declining during the second half of the month. Bearish sentiment jumped to 35.7% late in the month, rising above its historical average of 30.5% for the first time since mid-October.
- Stocks and Stock Funds: 71.4%, up 1.2 percentage points
- Bonds and Bond Funds: 14.4%, down 0.7 percentage points
- Cash: 14.2%, down 0.5 percentage points
- Stocks: 33.2%, up 1.6 percentage points
- Stocks Funds: 38.2%, down 0.4 percentage points
- Bonds: 2.0%, down 0.4 percentage points
- Bond Funds: 12.4%, down 0.3 percentage points
- Stocks/Stock Funds: 62.0%
- Bonds/Bond Funds: 16.0%
- Cash: 22.0%
Take the Asset Allocation Survey.
November 25, 2021 Reasons for Individual Investors to Be Grateful in 2021
November 18, 2021 The Tax Implications for Investors of Corporate Splits
November 11, 2021 Run Your Own Race: Investing as Marathon Training
November 4, 2021 Portfolio Reviews Can Often Lead to Doing Nothing

Discussion
Barry J from Texas posted over 4 years ago:
Ike and others facing life and death risks advise us that "having a plan to is everything," but they also caution us that "all plans fall apart when you meet the enemy." The enemy is not the variation of risk around the mean, which is concept that conveniently supports MPT's definition of risk, which is quoted in this article. As far as the measurement of risk tolerance of risk is concerned, Dan Kahneman and Amos Tversky's research since 1979 has demonstrated that risk tolerance is NOT a linear function. People tolerate HIGHER levels of risk when they expect HIGHER payoffs from their [investment] "bets," and tolerate much LOWER levels of risk in (ask they say) in "the domains of losses." Jimmy Conners said this best, "I hate to lose MORE THAN I love to win." Risk tolerance is asymmetrical, not linear. Yet EVERY time I discuss risk tolerance with a potential investment professional while preparing an investment plan, they ask me to estimate my risk tolerance using a highly simplified 5 to 7 point LINEAR scale which (oddly enough) is highly correlated to a very static and equally simplistic view of the needs of investors based on their AGE. This approach highly simplifies the job of the investment advisor and reinforces THEIR need to legally distance themselves from any possible legal liability for disappointing results derived from the investment plan they require that you formulate using their system. Never, never, never forget that investment information is BIG BUSINESS, not just a well-trained voice on the phone. Remember that it is the market forces generated by other investors -- "the invisible hand" -- that creates the variation you are asked to plan to tolerate. Most importantly, remember that -- even if you have several million dollars to invest -- as an independent investor, you are still the smallest fish in the food chain that in the investment industry. Paying attention to these "invisible" agencies should be recognized in your investment planning, not just brushed over with a simplified approach for "addressing" the very real threats that generate the need for a mandatory discussion of risk tolerance at all. I have sawed this log multiple times in other AAII article comments because I believe that modifying the approach to assess risk tolerance to align with Prospect Theory is a significant opportunity for AAII industry leadership in recognizing this deficiency in the current investment industry. What say you?
BWM from NY posted over 4 years ago:
Wait a second. What if my goals are to exploit short term market moves?
John Lambert from New Jersey posted over 4 years ago:
The fabled "ill-timed sequence of bad returns". An often spoken fear but rarely studied in any detail. Looking at sequential 30 year retirements starting in 1872 through 1990 shows that the probability of running out of cash before the end of a 30 year retirement increases as the safe assets (cash and equivalents) increase as a percentage of the retirement nest egg. The safest approach is to invest in 100% stocks and ignore market gyrations when withdrawing funds to pay for retirement living expenses rather than maintaining a safe fund and attempting to time the market (bucket approach). In his book Investing at Level 3, James Cloonan came to the same conclusion but believed it would be too difficult emotionally for a retiree to follow this approach.
Rob from NC posted over 4 years ago:
John from New Jersey is right on the money! (No pun intended.) There's a tax on those who allow emotion to direct their investing. It's called the stupidity tax. Those who invest in "safe" assets are the ones who pay the most of this tax over the course of their lifetimes. Volatility and risk have nothing to do with each other for a long-term investor.
You need to log in as a registered AAII user before commenting.
Create an account