

We Want Your Feedback on an AAII Journal Article Idea
by Charles Rotblut | February 02, 2023
Special note: You can receive everything that AAII produces through its four newsletters—Growth Investing, Dividend Investing, Stock Superstars Report and VMQ Stocks—and A+ Investor, AAII’s robust investment discovery suite for life. You’ll also get free access to every future AAII newsletter. No more renewals, no more jumping between newsletters, no more marketing emails. Sign up for AAII Platinum here.
We’re working on an idea for a potential AAII Journal article about mutual funds and exchange-traded funds (ETFs) and want to hear your suggestions and feedback. The article will focus on the process for choosing whether to use an actively managed or a passively managed (index) mutual fund or ETF. 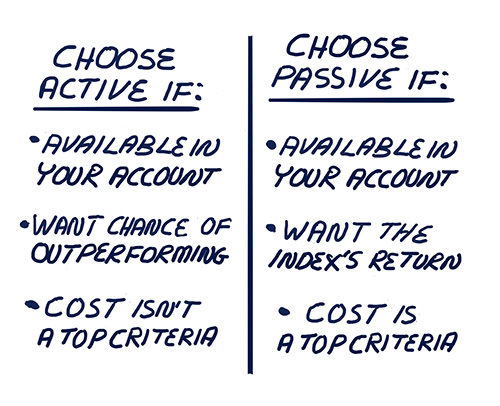
Actively managed funds rely on fund managers to handpick securities. Active managers may have the discretion to time the market and hold cash investments. They offer the potential, but not the guarantee, of beating the benchmark index or taking advantage of areas within the financial market less covered by indexes. Passively managed funds seek to mimic the returns of an underlying index. They tend to have very low expense ratios and are designed to limit the odds of underperforming the index.
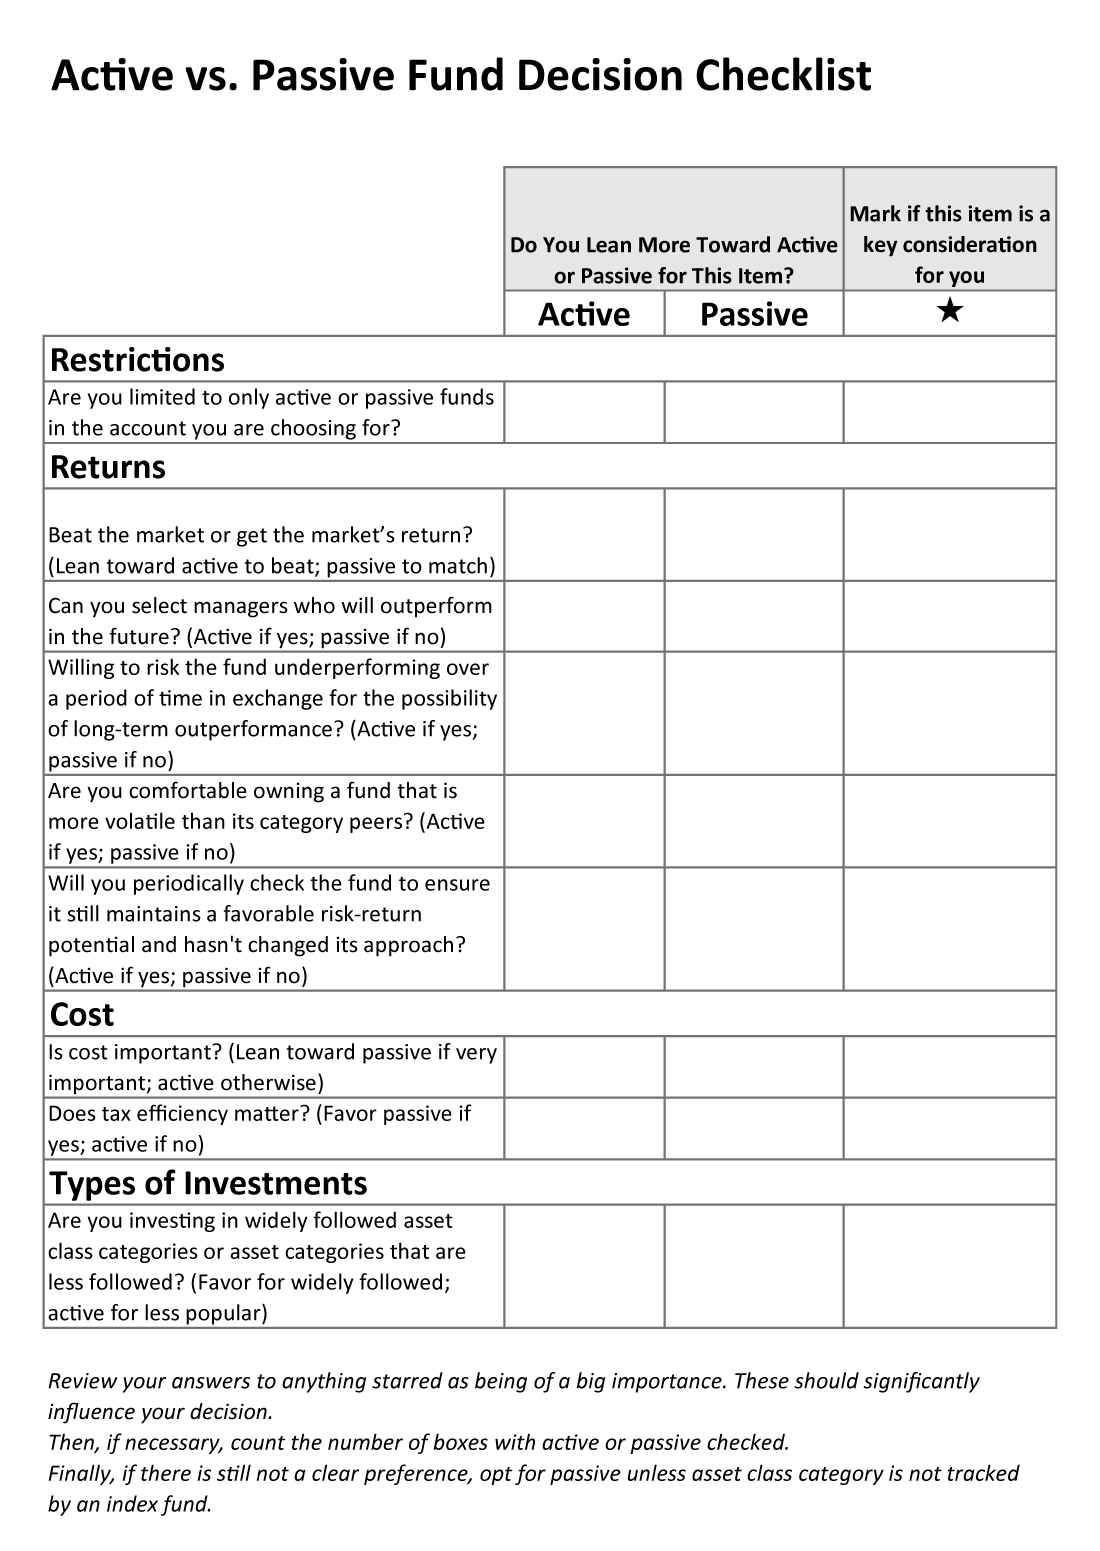
There are several ways in which an investor who is open to both types of funds could approach the decision process, but we think the simplest question is the first one that should be asked: Are there any restrictions on what you can invest in? If you are seeking a fund in a 401(k), 529 college savings plan or health savings account (HSA), you may have no choice but to buy, say, an actively managed mutual fund due to the plan’s offerings. In such instances, the decision is made for you.
Let’s go through the other considerations we’ve listed along with some notes (shown in parentheses).
Returns
Do you want to attempt to beat the market or get the market’s return?
- Beat the market—Active
- Get the market’s return—Passive
Do you think you can select managers who will outperform in the future? (Keep in mind that this is not easy to do, especially after factoring in the higher costs of active management.)
- Yes—Active
- No/Not sure—Passive
Are you willing to endure periods of underperformance for a chance of long-term outperformance? (Even good fund managers can underperform their peers for periods of a year or longer with their outperformance not truly being evident for periods of five or 10 years.)
- Yes—Active
- No—Passive
Are you comfortable owning a fund that is more volatile than its category peers? (The category risk index, which can be seen on the Evaluator quote pages on AAII.com, shows whether a mutual fund’s or an ETF’s returns have been more or less volatile than its peers.)
- Yes—Active
- No—Passive
Will you periodically check the fund to ensure it still maintains a favorable risk-return potential and hasn’t changed its approach?
- Yes—Active
- No—Passive
Cost
How important are low expense ratios to you? (The higher the expense ratio, the greater the gross return a fund must realize just to match its category average net return.)
- Very important—Passive
- Not the most important criteria—Either active or passive
Does tax efficiency matter? (This ratio measures how much of a fund’s annualized return is reduced by the taxes paid on distributions, assuming the maximum marginal tax rate. The lower the ratio, the more tax-efficient the fund. It is a consideration if you intend to hold a mutual fund or ETF in a taxable account.)
- Very important—Passive
- Not important—Either active or passive
Our original thought was to create a decision tree based on these questions. I pivoted on the idea for two reasons. First, it could end up being overly complex from a visual standpoint. Secondly, there are characteristics one investor may place greater importance on than the other. So, I switched to a checklist format as shown below.
We’d like to hear your comments and suggestions. Just leave them in the comments box located at the end of this week’s Investor Update.

-
Online Exclusive: Mutual Funds vs. ETFs: What Makes Them Different?
These two categories of professionally managed funds differ in important ways that should be taken into consideration before settling on an investment. -
Suggestions for Analyzing Mutual Fund and ETF Performance
How to more effectively use return data to help determine whether a fund is a worthy investment. -
The Individual Investor’s Guide to the Top ETFs 2023
Despite the rough market conditions, three big trends continue to aid ETFs. -
Analyzing Funds Amid Widespread Losses
If you use our mutual fund and ETF guides to determine whether a current fund holding still deserves a spot in your portfolio, a few key questions can help you decide if the investment is a keeper or a stinker. -
PRISM Step 2: Recognizing Your Risk Tolerance and Allocation
Anine Sus figures out how much risk she’s willing to take with her investments and what that means about her optimal mix of assets in her latest My Investing Discoveries blog post.
Members are looking for your input. Can you help with this question from the Options Investing Strategies Community?
“I’ve been reading about various retirement account strategies and the pros and cons of each. Two strategies, covered calls on shares and put options, caught my attention. Do you trade options in a Roth IRA? And, if so, what strategy do you typically lean toward?”
Tap the button and then choose the Join the Community button on the right to answer this question in the AAII Community
Answer This Question in the AAII Community »
AAII Sentiment Survey
Optimism among individual investors about the short-term direction of the stock market rose according to the latest AAII Sentiment Survey. Neutral sentiment also rose, while pessimism fell.
Bullish sentiment, expectations that stock prices will rise over the next six months, rose 1.5 percentage points to 29.9%. This is the highest level of optimism registered by the survey since November 17, 2022 (33.5%). Nonetheless, bullish sentiment remains below its historical average of 37.5% for the 57th consecutive week.
Neutral sentiment, expectations that stock prices will stay essentially unchanged over the next six months, rose 0.6 percentage points to 35.5%. Neutral sentiment is above its historical average of 31.5% for the fifth consecutive week. At five weeks, this is the longest streak of above-average neutral sentiment since a five-week stretch in March and April 2022.
Bearish sentiment, expectations that stock prices will fall over the next six months, fell 2.1 percentage points to 34.6%. This is the first time since January 2022 that pessimism is below 40% for four consecutive weeks. Bearish sentiment is above its historical average of 31.0% for the 60th time out of the past 63 weeks.
The bull-bear spread (bullish minus bearish sentiment) is –4.7%. This is still below the historical average of 6.6%.
Concerns about the economy, inflation, corporate earnings and volatility in the stock market continue to cause many individual investors to maintain a cautious short-term outlook.
Bullish: 29.9%, up 1.5 points
Neutral: 35.5%, up 0.6 points
Bearish: 34.6%, down 2.1 points
Bullish: 37.5%
Neutral: 31.5%
Bearish: 31.0%
See more Sentiment Survey results.

AAII Asset Allocation Survey
Individual investors’ exposure to equities reached an eight-month high in January. The January AAII Asset Allocation Survey also shows rising fixed-income allocations and declining cash allocations.
Stock and stock fund allocations increased by 1.4 percentage points to 65.3%. This is the highest reading since May 2022 (67.1%). Equity exposure remains above the historical average of 61.5% for the 32nd consecutive month.
Bond and bond fund allocations grew slightly, increasing by 0.3 percentage points to 14.6%. Bond and bond fund allocations are below their historical average of 16.0% for the 23rd consecutive month.
Cash allocations fell by 1.7 percentage points to 20.1%. Even with the decline, this is the eighth consecutive month that cash allocations are above 20.0%. However, cash allocations are below their historical average of 22.5% for the second consecutive month.
Stock prices rose in January while bond yields fell. Nonetheless, optimism about the short-term direction of the stock market remained well below its historical average in January. Concerns remain about the overall direction of the economy, inflation and potential interest rate hikes.
- Stocks and Stock Funds: 65.3%, up 1.4 percentage points
- Bonds and Bond Funds: 14.6%, up 0.3 percentage points
- Cash: 20.1%, down 1.7 percentage points
- Stocks: 31.9%, up 0.2 percentage points
- Stocks Funds: 33.4%, up 1.2 percentage points
- Bonds: 4.3%, up 0.0 percentage points
- Bond Funds: 10.3%, up 0.3 percentage points
- Stocks/Stock Funds: 62.0%
- Bonds/Bond Funds: 16.0%
- Cash: 22.0%
Take the Asset Allocation Survey.
January 26, 2023 Two Ways to Select a Stock From a Screen
January 19, 2023 Closed-End Muni Bond Funds Are Cutting Their Payouts
January 12, 2023 Optimism Among Individual Investors Was Historically Low Last Year
January 5, 2023 Where Market Indicators Stand as the Bear Market Turns One

Discussion
Steve Rawlinson from California posted over 3 years ago:
The consideration for beating the market in the article argues for active. But by trying to time the market, this can be done with passive funds. I was lucky in getting to the sidelines in 2022 and getting back in at the start of 2023, so I beat the market with my passive funds. Another form of active selection can be asset allocation among passive funds.
John Sedivy from SC posted over 3 years ago:
Overall it's a good thought structure for someone trying to decide.
Daniel Bikle from CA posted over 3 years ago:
The odds of choosing a fund manager who can produce above market returns exceeding the costs involved over an extended period of time is vanishingly small. This to my mind is the biggest knock against actively managed funds that one wants to keep in a portfolio for the long run.
Benjamin Green from New Mexico posted over 3 years ago:
I usually drift toward etfs to follow a certain sector, for example I have shares in a robotics etf and in a video game etf. I want exposure to these potentially high-growth sectors, but I also want to spread my risk among several companies rather than invest in stock from one company. Because these etfs are limited in their scope, active management is a given. It takes some serious research to find out who manages a fund and what their track record is. Plus, managers seem to change all the time. It is not worth my effort to consider that question. The big question for most investors is do they want to do the research to manage their own portfolio. If the answer is no, then you are really left with choosing between a selection of passive funds or hiring someone to manage your portfolio.
Ed from Oregon posted over 3 years ago:
I agree that the checklist format works better than a decision tree for this
Rob from NC posted over 3 years ago:
For me, this introduces irrelevancy into the decision-making process. (Volatility is always irrelevant.) I own low-expense-ratio equity index ETFs for the sole purpose of diversification (while expecting them to at least keep up with the market). Such ownership is a risk-reducer. My market-beating assets are individual stocks. None of my accounts has restrictions on what types of assets I buy. I avoid active funds for the simple reason that, on average, they are less likely than index funds to keep up with the market in the long run. Simple probability indicates that I'm likely to do better in an arbitrarily chosen index fund than in a given active fund.
Gary from TX posted over 3 years ago:
I would remove tax-efficiency from the criteria, for two reasons: 1) There are tax-managed O/E mutual funds which do not generate capital gains, e.g. Vanguard has a couple 2) Tax efficiency is more a function of wrapper type, so the same passive strategy in general is more efficient as an ETF because it won't have capital gains distributions -- e.g. IVV vs BSPAX or WFSPX -- all S&P 500 index funds from iShares. IVV does not distribute any capital gains, but the O/E mutual funds do, regularly, a portion of which has been S/T, so even worse taxwise. If you want to expand this to also do a wrapper type comparison, then you could put the tax-efficiency in it, and also add trading/liquidity. Because ETFs are listed and trade as stocks, there can be more fungible when changing vehicles, whereas moving from one O/E mutual fund to another can incur a day's delay where you are uninvested if the funds are not sponsored by the platform's owner, e.g. Vanguard to non-Vanguard, Fidelity to non-Fidelity, etc. The ETFs also allow you to time your trades intra-day, if you think that's of value.
John L from NJ posted over 3 years ago:
Active funds have a slim chance of outperforming the market and a much greater chance of under performing. According to SPIVA over 20 year periods 94% of active funds have fallen short of their market index. Even worse there is no known method for determining the 6% of active funds that will out perform the market in the next 20 years. Pick a small portfolio of active funds and the odds of beating the market overall is less than 1%. So I would remove the hope from your chart for active funds out performing the market. Consider adding a warning that picking active funds is likely to result in below market returns. Costs should be important to everyone. The higher the costs; the lower the returns to the fund holder.
Jim Bennett from FL posted over 3 years ago:
In any discussion like this, you need to say why one or the other is better than a direct investment in an individual company’s securities. It is not alway obvious.
Karl from WV posted over 3 years ago:
In your discussion of tax efficiency you should note that in qualified retirement accounts like IRAs and 401Ks, tax efficiency just doesn't matter. In Roth accounts, once your money is in the account, you never pay taxes either at the time a transaction takes place or when you withdraw the funds. In traditional account, you pay taxes only on withdrawals; and then, taxes are levied solely on the dollar value of the withdrawal, not the source of the funds within the account.
H Poole from NC posted over 3 years ago:
Several comments. One, I only use ETFs for large indexes like S&P. I can't see that any active fund will reliably beat them. However I think there are opportunities for active management in areas like small cap, international, and emerging markets. Two, "Beating the market" can mean a number of things and it all depends on the benchmark. Can they beat the S&P 500 (not likely)? Or are they beating the MSCI World (even SPY does that)? The only place I care about cost is in large index ETFs. Otherwise I don't care about cost if the return justifies it. I review every fund/etf/stock at least quarterly to see what their trends are. I also keep an active list of alternatives - if an investment no longer makes sense, I will switch or change. Anyone remember Mutual Quaified? I am very tax conscious and try to keep different investments in the appropriate places.
Rkb from Oregon posted over 3 years ago:
It would seem that the track record of actively managed funds would make chasing them an inefficient use of time and resources but maybe it's worth an article. A better discussion for me would be when to chose a mutual fund over the same or similar ETF. The distinction between the two is becoming so blurred that I find more of my holdings are skewed towards ETFs now.
Ian Radford from Richmond upon Thames posted over 3 years ago:
A criterion; two criteria. Similarly, an index; two indices. Does nobody receive a good education these days?
Jim I from UT posted over 3 years ago:
I like the idea for an article. As others have mentioned, I'd distinguish between an active vs passive debate from a debate between mutual funds and ETF. I'm less familiar with the latter, so that would be of interest. In addressing the active vs passive decision, I'd also include the dimension of whether people manage their own money or pay an advisor for such. I work primarily through an advisor for reasons beyond investment return. Some reasons include the fact that not being retired, I can't always maintain the same consistent focus on the portfolio as I would otherwise want (no, not talking day trading!). It's a good insurance policy for my wife who's not interested in investing should something happen to me. Lastly it's a good check against emotional decisions. Now with that said an advisor is going to try to beat the market meaning they're not going to just sit in index funds unless I insist on such. I don't. But I do monitor their performance.
Andre O. from MD posted over 3 years ago:
One question should be related to allocation. Are they currently 100% equities or 60/40? If they are anything less than 100%, they are not likely going to beat the market for their overall portfolio. So the question should be clearly focused on the equity portfolio. If a fund Manager does beat the market it would have such a small positive impact to a 60/40 portfolio.
Barry from TX posted over 3 years ago:
Charles, this is my input for an article. Create a checklist-style instrument that can be used to self-evaluate how recent investment decisions align with the key steps in the PRISM process. The PRISM process provides more than one way to invest to achieve your goals as long as you maintain alignment ( and fidelity) with your stated goals and risk tolerance. PRISM’s base premise is that all investors are like the families in Tolstoy’s “Anna Karenina”: “All happy families are alike, but every unhappy family is unhappy in its own way.” Substitute “investors” for “families” and this quote provides good advice that might guide you on how to solve your question. The Active vs. Passive Decision Checklist” in this article is a good template that can be expanded to create a more detailed assessment tool to help nudge us more emotional than rational investors to evaluate and identify the variances we have introduced in what we believe to be aligned with the versions of the PRISM process they carry in their minds. If that doesn’t work, I suggest a variation modeled on the 12-step AA process. “Hi,. My name is Barry. I am an independent investor. It’s been x days since I made my last bad investment decision.”
Barry from TX posted over 3 years ago:
Charles, my second suggestion is to have a few of the high-profile “swing-for-the-fences” investors write articles on what they have learned from their mistakes. Here are some potential back-sliders for such a list: Tim Ferriss, author of “4-Hour Workweek,” Barstool Sports founder David Portnoy, the billionaire venture capitalist Chamath Palihapitiya, and the longest of these long shots, Cathie Wood CEO of ARK infamy. These folks would have some very interesting testimony of what they have learned from their high-profile investing mistakes, but there is more than one massive ego issue to navigate around here.
Juan Galan from Florida posted over 1 year ago:
In your allocation survey you do not include Private Equity investments which some of us use for as much as 30% of our portfolio diversified over: Real Estate[multiple holdings]; Private Credit; Infrastructure.
You need to log in as a registered AAII user before commenting.
Create an account