

Where Market Indicators Stand as the Bear Market Turns One
by Charles Rotblut | January 05, 2023
The bear market marked its one-year anniversary on Tuesday afternoon.
S&P Dow Jones Indices defines a bear market as a 20% drop in the S&P 500 index from the last closing high. The current bear market will continue to exist until the large-cap index posts a close higher than 4,292.44. This level is 20% above the current bear market’s closing low of 3,577.03, which was set on October 12, 2022.
I’d love to tell you when the next bull market will start. Unfortunately, my—and everyone else’s—crystal ball remains cracked. (When we asked the the office Magic 8 Ball if the market will be up this year, its answer was “Better not tell you now”.) What I can do is give you some insights about where the markets are as of the start of 2023.
Before I do, there is one key indicator individual investors don’t have to focus on: quarterly and annual performance. Professional fund and money managers are measured based on how they perform on a shorter-term basis relative to benchmarks and their peers. Our success as individual investors is measured by our ability to meet our goals. It’s a different mindset that allows us to tailor our portfolios to our needs as opposed to someone else’s performance demands.
With that said, here are some current financial market indicators.
Valuations Are Mixed—The S&P 500 was trading at 17.3 times trailing earnings and 17.3 times projected earnings for the next four quarters as of December 30, according to Refinitiv. This is neither cheap nor expensive. The S&P MidCap 400 index and the S&P SmallCap 600 index are much more attractive valuation-wise. Their trailing price-earnings (P/E) ratios were both 12.5 at the end of last week. Their forward price-earnings ratios were 13.4 and 13.1, respectively.
Price-to-Book Ratios Show Small-Cap Stocks Remaining Relatively Cheap on a Historical Basis—For the past few years, we at AAII have pointed out how small-cap stocks have traded at larger-than-average discounts relative to large-cap stocks. Small-cap stocks continue to be on sale. The median price-to-book ratio for the S&P SmallCap 600 was 1.67 at the end of 2022. This is approximately half of the S&P 500’s median price-to-book-value (P/B) ratio of 3.25. The historical average discount for small-cap stocks since 1988 has been 67% of large-cap stocks’ price-to-book ratio.
The discount persists despite the outperformance of small-cap stocks. In 2022, the S&P 500 fell by 18.1% whereas the S&P SmallCap 600 declined by 16.1%.
Analysts Have Become Less Optimistic About 2023 Earnings—Analysts are currently forecasting earnings for the S&P 500 to grow 4.4% this year. This forecast is down from October’s forecast of 7.8% growth and July’s consensus call for 9.3% growth. There are two big things to keep in mind when looking at these numbers: Analysts routinely underestimate corporate earnings, and analysts’ forecasts become less accurate over longer time periods.
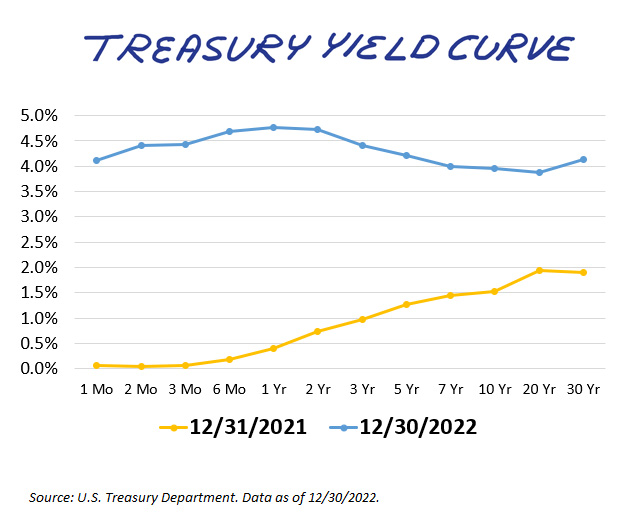 Bond Yields Are Really Inverted—The 4.76% yield on the six-month Treasury bill as of the end of 2022 was nearly a full percentage point higher than the yield on the 10-year note. It was also about 80 basis points (bps) higher than the yields on the five- and seven-year notes. This inversion can clearly be seen in the first chart.
One oft-cited recession indicator is when the two-year note’s yield is above the 10-year note’s yield. The two-year note’s yield has been higher, on average, for the past two calendar quarters, which is a recessionary signal. Plus, the Federal Reserve has a lousy record of achieving soft landings following rate-tightening cycles.
It’s worth noting that there have been predictions of a recession occurring for many months now. More than two-thirds of economists at the investment banks and trading firms that do business directly with the Fed (aka, primary dealers) expect the U.S. to fall into a recession this year, according to The Wall Street Journal. To the extent the financial markets are efficient at pricing in all known information, at least some of this risk should already be priced in.
(Notably, Campbell Harvey, who identified the link between inverted yield curves and recessions, thinks the yield curve could be giving a false signal. “Ideally, we avoid the hard-landing recession and realize slow growth or minor negative growth. If a recession arrives, it will be mild,” said Harvey on LinkedIn yesterday.)
Diversification Disappointed in 2022—You may have seen me make this point in the January 2023 AAII Journal. There weren’t many areas of the market to hide. Stocks, bonds, real estate investment trusts (REITs) and cryptocurrencies fell last year. Major commodities like oil and gold were roughly flat on a calendar-year basis. What was up were yields on certificates of deposit (CDs) and other short-term, safe assets. Diversification didn’t break, but it experienced a bad year.
Inflation May Have Peaked—I say this with fingers crossed, but inflation is showing signs of having reached a peak for the current cycle. The consumer price index (CPI) rose 7.1% in November, down from 9.1% in June. The bond market’s expectations for inflation over the next five and 10 years have also declined from their 2022 highs. While inflation remains nowhere near the Fed’s stated target, it has been heading in the right direction. This, in turn, suggests we could also be nearing the end of the Fed’s current tightening cycle. (Interest rates could stay at comparatively elevated levels for a while after the Fed pauses.)
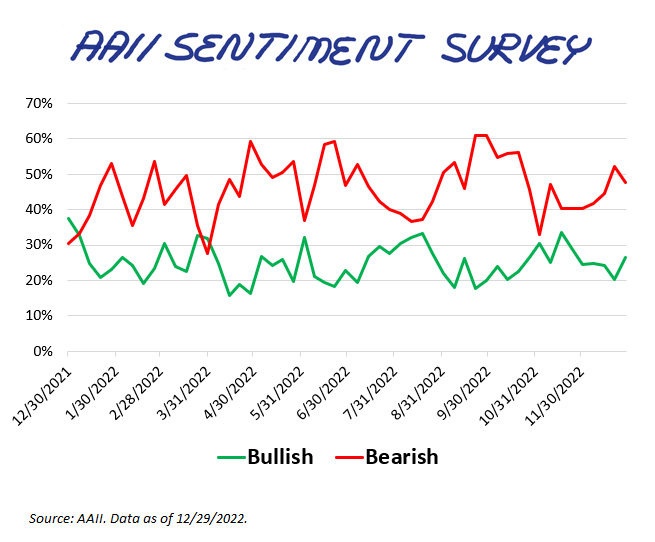 Optimism About the Stock Market Is Low—Optimism in our weekly AAII Sentiment Survey was unusually low 38 times last year. The AAII bull-bear spread (bullish sentiment minus bearish sentiment) was also unusually low 38 times. Historically, unusually low levels for both have been followed by higher-than-average (and median) returns in the S&P 500.
Bank of America’s Bull & Bear Indicator was 2.0 in early December, equivalent to the high level of extreme bearishness. The Investors Intelligence survey found that 37.5% of newsletter writers were bullish and 33.3% were bearish as of December 20, 2022. Near the end of 2021, bulls were exceeding 50%.
What does all this mean for the average investor? There are reasons for pessimism (the inverted yield curve and falling earnings estimates) and reasons for optimism (inflation may have peaked, valuations on mid-cap and small-cap stocks are cheap and investor sentiment is poor). If we had absolute certainty about the future, returns would be lower.
It may not sway your opinion either way, but the calendar does offer a few reasons for optimism. It is rare to see either large-company or small-company stocks experience negative returns on back-to-back calendar years. The third year of presidential terms tends to be positive for stocks. (The market has also done well when a Democrat is president and control of U.S. Congress is split, though the sample size is small with just four such years since 1945.) Finally, the S&P rose during the Santa Claus rally period. Historically, when stocks rise during the final five sessions of a year and the first of the next year, it’s generally been a good sign.

-
Stock Market Retreats and Recoveries
Only six months, on average, have separated the end of one decline and the start of the next one, but recoveries have been quick. -
Using Seasonal and Cyclical Stock Market Patterns
Presidential terms, the calendar month and a basket of January indicators give insight into market direction. -
New Year, New Investments, Same Strategy
Anine Sus takes stock of her ETF portfolio and decides what to sell in her latest My Investing Discoveries blog post. -
The Importance of Filtering Out the Urge to Trade
How one longtime market observer became a big believer in behavioral finance over the years. -
Influx of New Blood for Model Shadow Stock Portfolio
After removing four stocks during the quarterly review, six new stocks were added.
Members are looking for your input. Can you help with this question from the Allocation Strategies Community?
“In the newest issue of the AAII Journal, Charles Rotblut discusses tangible ways to get your portfolio ‘back on track’ in the new year following a tough bear market. What portfolio moves are you making or not making in response to last year’s returns in equities and bonds?”
Tap the button and then choose the Join the Community button on the right to answer this question in the AAII Community.
Answer This Question in the AAII Community »
AAII Sentiment Survey
Optimism and pessimism among individual investors about the short-term direction of the stock market fell, while neutral sentiment jumped to a 40-week high.
Bullish sentiment, expectations that stock prices will rise over the next six months, fell 6.0 percentage points to 20.5%. Optimism remains below its historical average of 37.5% for the 53rd consecutive week. This is the second time in three weeks with a bullish sentiment reading ranking among the 60 lowest ever recorded since the survey started in 1987.
Neutral sentiment, expectations that stock prices will stay essentially unchanged over the next six months, jumped by 11.6 percentage points to 37.5%. Neutral sentiment was last higher on March 31, 2022 (40.6%). The historical average is 31.5%.
Bearish sentiment, expectations that stock prices will fall over the next six months, fell 5.6 percentage points to 42.0%. Bearish sentiment is above its historical average of 31.0% for the 56th time out of the past 59 weeks and is at an unusually high level for the fifth consecutive week.
The bull-bear spread (bullish minus bearish sentiment) is –21.5%. This is well below the historical average of 6.6%. The bull-bear spread remains unusually low for the sixth consecutive week.
Historically, the S&P 500 index has gone on to realize above-average and above-median returns during the six- and 12-month periods following unusually low readings for bullish sentiment and the bull-bear spread. Unusually high bearish sentiment readings historically have also been followed by above-average and above-median six-month returns in the S&P 500.
Concerns about the economy, inflation, corporate earnings and volatility in the stock market continue to cause many individual investors to maintain a cautious short-term outlook.
Bullish: 20.5%, down 6.0 points
Neutral: 37.5%, up 11.6 points
Bearish: 42.0%, down 5.6 points
Bullish: 37.5%
Neutral: 31.5%
Bearish: 31.0%
See more Sentiment Survey results.

AAII Asset Allocation Survey
Cash as a percentage of individual investors’ portfolios continued to pull back from a 2.5-year high. The December AAII Asset Allocation Survey also shows equity allocations rising and fixed-income allocations rebounding.
Stock and stock fund allocations increased by 1.5 percentage points to 63.9%. Despite two consecutive monthly increases, it was still the fourth-lowest reading since December 2020 (67.6%). Equity exposure remains above the historical average of 61.5% for the 31st consecutive month.
Bond and bond fund allocations grew slightly, increasing by 0.7 percentage points to 14.3%. Bond and bond fund allocations are below their historical average of 16.0% for the 22nd consecutive month.
Cash allocations fell by 2.2 percentage points to 21.8%. Even with the decline, this reading is the fourth highest in the last 32 months. However, cash allocations have fallen below their historical average of 22.5%.
Optimism about the short-term direction of the stock market continued to be unusually low throughout December. Concerns remain about the overall direction of the economy, inflation and potential interest rate hikes.
- Stocks and Stock Funds: 63.9%, up 1.6 percentage points
- Bonds and Bond Funds: 14.3%, up 0.6 percentage points
- Cash: 21.8%, down 2.2 percentage points
- Stocks: 31.8%, up 1.4 percentage points
- Stocks Funds: 32.2%, up 0.2 percentage points
- Bonds: 4.3%, up 0.5 percentage points
- Bond Funds: 10.0%, up 0.1 percentage points
- Stocks/Stock Funds: 62.0%
- Bonds/Bond Funds: 16.0%
- Cash: 22.0%
Take the Asset Allocation Survey.
December 29, 2022 Eight Individual Investor New Year's Resolutions for 2023
December 22, 2022 Changes to Retirement Savings Included in the Omnibus Bill
December 15, 2022 SEC Proposes New Rules Regarding Stock Trade Execution
December 8, 2022 Seek Dividend Growth Instead of Yield During Recessions

Discussion
Rob from NC posted over 3 years ago:
Optimism, pessimism, fear, hope, sentiment, and all the other emotions have NO PLACE in directing your investments. Bogle was right--stay the course! Yes, it's painful to watch your portfolio decline in value. It's even worse when it stays down for a long time. But unless our country is truly in catastrophic decline--on the order of the sacking of Rome--the market won't stay down forever. It will pop back up when you least expect it, so don't get caught sitting on the sidelines when it does! I've stayed 100% invested in equities through the crash of '87, the dot-com bust of 2000, and the 2007-09 meltdown. Trust me, the joy waiting on the other side of the trough is worth the pain we're feeling right now.
Barry from TX posted over 3 years ago:
Paul Samuelson joked years ago, “Economists have predicted 9 of the last 5 recessions.” Like a Magic 8 Ball, a lot of people pick and choose their statistics more or less randomly to make the case they want to champion at the moment. On Fox Business News I see lots of people promoting their favorite “hard times” elixir – gold, silver, crypto, reverse mortgages, etc. – using the same Magic 8 Ball data-gathering approach. They all have something in common – they use data like a drunk uses a lamp post -- for support, not for illumination. I do not see anyone using the same set of data points in a consistent model and sticking to them to make a consistent case, not even my favorite 12 prescient economically-trained Carnacs, the Fed OMC, where currently 100% of them are currently predicting the recession they missed the last 3 times. As Rob suggests, if you have followed the 5-step PRISM process and have aligned your portfolio with your long-term goals and risk tolerance, staying the course is as good a strategy as any other. A. Lincoln, who saw more than our meager share of troubles once said at his darkest moment, “This too shall pass.”
AW from IL posted over 3 years ago:
The draw down started in January 2022 but the bear market level was not reached until June 13th 2022. Doesn't that make the bear market only a bit more than six months old?
You need to log in as a registered AAII user before commenting.
Create an account