

PEG Ratios Are Often Based on Just a Single Forecast
by Charles Rotblut | February 05, 2026
Growth at a reasonable price (GARP) is a popular style of investing. It ties valuation to a company’s growth prospects. Those prospects are frequently based on analysts’ expectations—and that’s where weaknesses can occur.
As Cynthia McLaughlin explained in a recent AAII Growth Investing insights, GARP strategies are generally based on the price-earnings-to-earnings-growth (PEG) ratio. PEG ratios divide the price-earnings (P/E) ratio by the earnings growth rate.
The PEG ratio is useful because it adjusts the valuation of a company for growth expectations. This makes it possible to compare the valuations of faster-growing companies with those of slower-growing companies.
A PEG ratio of 1.00 often indicates fair value. PEG ratios below 1.00 may suggest undervaluation, while ratios above 1.00 can indicate that a stock is priced high relative to its growth potential. Actual median ranges vary based on market conditions, as is the case for other valuation ratios.
You can estimate your own earnings growth rate, though many investors rely on consensus estimates instead. A consensus estimate is the average of all analyst forecasts provided to a data aggregator such as S&P Global Market Intelligence. How many forecasts are included in a consensus estimate varies both by company and future fiscal year(s).
Two factors influence how many analysts comprise a particular consensus estimate. Investor interest, particularly institutional investor interest, is one. More research is provided on widely followed stocks than on less-followed stocks. The second factor is time. A larger number of earnings estimates are provided for the current fiscal year (Y0) and the upcoming fiscal year (Y1) than for years further into the future.
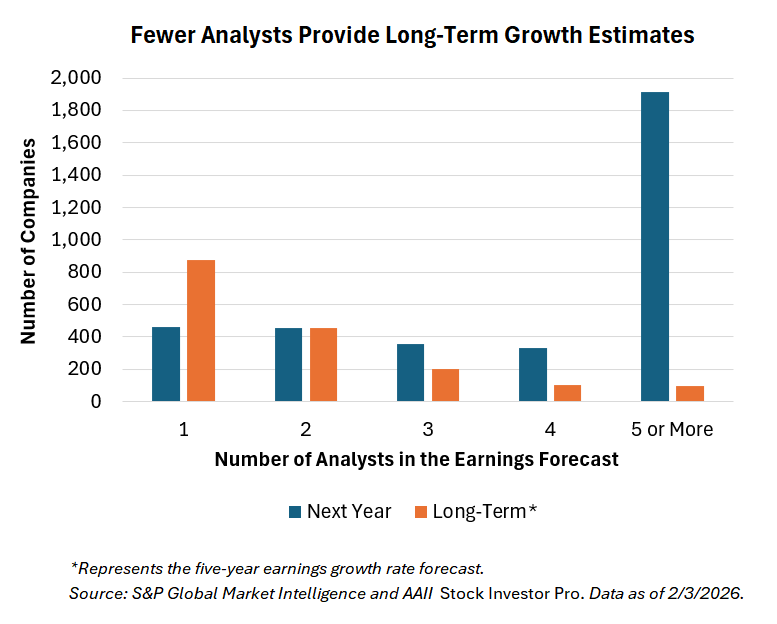 S&P Global has Y1 consensus estimates for 3,516 exchange-listed stocks. More than half (54.5%) of these consensus estimates are based on forecasts from five or more analysts. The larger the number of analysts, the more likely you are to get diverse opinions included in the consensus estimate. (Y1 is 2027 for companies that have already reported their 2025 results and 2026 for those that have yet to report.)
Y2 (2028/2027) consensus estimates are available for 2,959 stocks. This may not seem like a big drop until you look closer. There is a nearly 10-percentage-point drop in the number of companies with forecasts from five or more analysts (from 54.5% to 44.9%). Furthermore, the percentage of stocks with a forecast from only one analyst is 19.2% for Y2 versus 13.1% for Y1.
The biggest drop occurs with the long-term growth rate. S&P Global defines this as the median of analysts’ expected long-term (five-year) earnings per share growth rates. The long-term growth rate is the most used number for calculating the PEG ratio.
Long-term growth estimates are available for just 1,728 companies. Half (50.5%) of those estimates reflect the expectations of a single analyst. A mere 5.4% of all exchange-listed stocks have five or more analysts providing long-term growth estimates.
It is easy to see how just a single optimistic or pessimistic analyst can significantly influence the PEG ratio. An overly bearish forecast will make the ratio expensive (well above 1.00). An overly optimistic forecast will make the ratio cheaper (near or below 1.00).
There are a couple of adjustments you can make. First, consider using a shorter growth rate, such as one derived from the Y1 and Y2 consensus earnings estimates. Second, allow a margin of error into the PEG ratio. You can do this by viewing the PEG ratio as being on a spectrum. Lower PEG ratios provide a greater margin of safety against overly optimistic forecasts. Higher PEG ratios leave little room for error if analysts are too bullish.
The median PEG ratio for exchange-listed stocks is currently 2.32. This is well above the 1.00 PEG ratio traditionally considered to indicate a fair valuation. Though elevated, it provides an additional benchmark by which to judge which stocks are expensive relative to their projected growth rate.

-
Estimate Revisions May Reveal Potential Outperformers
AAII’s Estimate Revisions Up 5% screening model focuses on firms with at least a 5% increase in annual earnings estimates over the last month. -
Spotting Value on the Move With the PEG Ratio
Avoid the value trap with stock screens that isolate reasonably priced stocks exhibiting earnings growth and price appreciation. -
The Individual Investor’s Guide to the Top ETFs 2026
Commodity-focused and equity precious metals ETFs topped the list for 2025. See the newly posted February 2026 AAII Journal for more about these and other ETF winners in a year where the majority posted positive performance.
AAII Sentiment Survey
Neutral sentiment among individual investors about the short-term outlook for stocks increased in the latest AAII Sentiment Survey. Meanwhile, both optimism and pessimism decreased.
Bullish sentiment, expectations that stock prices will rise over the next six months, decreased 4.7 percentage points to 39.7%. Bullish sentiment is above its historical average of 37.5% for the 10th consecutive week.
Neutral sentiment, expectations that stock prices will stay essentially unchanged over the next six months, increased 6.5 percentage points to 31.3%. Neutral sentiment is below its historical average of 31.5% for the 81st time in 83 weeks.
Bearish sentiment, expectations that stock prices will fall over the next six months, decreased 1.8 percentage points to 29.0%. Bearish sentiment is below its historical average of 31.0% for the seventh time in 10 weeks.
The bull-bear spread (bullish minus bearish sentiment) decreased 2.9 percentage points to 10.7%. The bull-bear spread is above its historical average of 6.5% for the 10th consecutive week.
This week’s special question asked AAII members what they thought about the Federal Reserve’s decision to keep interest rates unchanged.
Here is how they responded:
- They should have raised rates: 7.0%
- It was the right move: 68.6%
- They should have cut rates: 17.1%
- Not sure/no opinion: 7.0%
Bullish: 39.7%, down 4.7 points
Neutral: 31.3%, up 6.5 points
Bearish: 29.0%, down 1.8 points
Bullish: 37.5%
Neutral: 31.5%
Bearish: 31.0%
See more Sentiment Survey results.

AAII Asset Allocation Survey
Individual investors’ allocations to bonds increased while stock and cash allocations decreased in the January AAII Asset Allocation Survey.
Stock and stock fund allocations decreased 0.6 percentage points to 70.2%. Stock and stock fund allocations are above their historical average of 61.5% for the 68th consecutive month.
Bond and bond fund allocations increased 1.0 percentage points to 15.4%. Bond and bond fund allocations are below their historical average of 16.0% for the sixth time in 10 months.
Cash allocations decreased 0.4 percentage points to 14.4%. Cash allocations are below their historical average of 22.5% for the 38th consecutive month.
- Stocks and Stock Funds: 70.2%, down 0.6 percentage points
- Bonds and Bond Funds: 15.4%, up 0.9 percentage points
- Cash: 14.4%, down 0.4 percentage points
- Stocks: 29.1%, down 0.7 percentage points
- Stocks Funds: 41.1%, up 0.1 percentage points
- Bonds: 4.5%, down 0.2 percentage points
- Bond Funds: 10.8%, up 1.1 percentage points
- Stocks/Stock Funds: 62.0%
- Bonds/Bond Funds: 16.0%
- Cash: 22.0%
Take the Asset Allocation Survey.
January 29, 2026 Activist-Owned Competitors Outperform Activist Targets
January 22, 2026 January Charts of Interest: Yields Are Falling
January 15, 2026 Stock Market Returns Following Streaks of Double-Digit Gains
January 8, 2026 The New Features in Our Rebuilt My Portfolio

Discussion
Rob from NC posted 8 months ago:
Basing an investment decision on ANY analyst's prognostications is a recipe for disaster. Too many variables. Too many unknowns. Too many conflicts of interest. Too much bias. Just buy an index ETF. You'll be much happier in the long run.
Barry from TX posted 8 months ago:
#1 As Charles and Dr. Bob both point out, using multiple (>5) equally biased and flawed analysts' opinions to calculate the "mean" only introduces the effect of the second movementof an independent distribution, i.e., variation, the bugaboo of all investing decisions. #2 As usual, I wholeheartedly endorse ALL 4 of Dr. Bob’s reasons in his “recipe for disaster.” And, as usual, I also have a more acerbic opinion because I am suspicious of analysts' "professionalism.” #3 The title “analyst” and the label “certified” are so vague and misused (See Dr. Bob’s evidence list.). #4 I add that BOTH the “daily money managers” recently featured as “experts” to help retirees balance their checkbooks FOR A FEE and “Penny,” the Doberman, who just won the Westminster Best in Show, are also “certified.” Maybe I need to apologize to Penny. She is certifiably gorgeous. #5 Certifications in finance are meaningless. The “profession” attracts folks who SEEK TO “manage” other people’s money … to finance their lifestyle. As the saying goes, who has more yachts? #6 I am also certain that (1) 50% of ALL analysts graduated in the bottom half of their certification process, and (2) that they work for a company that has a “special interest” in the companies they assign an analyst to cover. #7 I am equally certain that two or more analysts can arrive at widely differing estimates based on the same data sets (for “different” reasons – see #2 above). For example, if you want more coverage for a stock, a company can just add analysts right off The Street with a Help Wanted Ad. Viola! #8 Yes, I am permanently bent on the subject of “professionalism” in the financial industry. #9 Here’s a happy ending to this tirade. Somewhere, several groups of programmers are training their GAI LLM databases to write code that fully automates the jobs of ALL “financial analysts” that eliminate all “analysts” jobs. #10 I have been following the SCHW and MORN surveys on how GAI will impact “certified” “independent financial advisors,” and the advisors’ responses to what they think their value add will be with all that freed-up time. They are next, maybe even first. They have no value-add that CoPilot 5.0 can’t deliver in 5 seconds. #11 These issues testify to the advantages that independent investors have, as Bogle and Cloonan et al have documented. Regards.
You need to log in as a registered AAII user before commenting.
Create an account