

January Charts of Interest: Yields Are Falling
by Charles Rotblut | January 22, 2026
Featured Tickers: IEFA
IVV
IYY
IEFA
IVV
IYY
Greetings from chilly Chicago—brrr! This year’s first charts of interest starts with a look at the current yield environment for stocks and bonds. We then go global with international stocks, before moving onto gold, the U.S. dollar and, since it’s cold outside, cocoa.
A New Low for Stock Yields
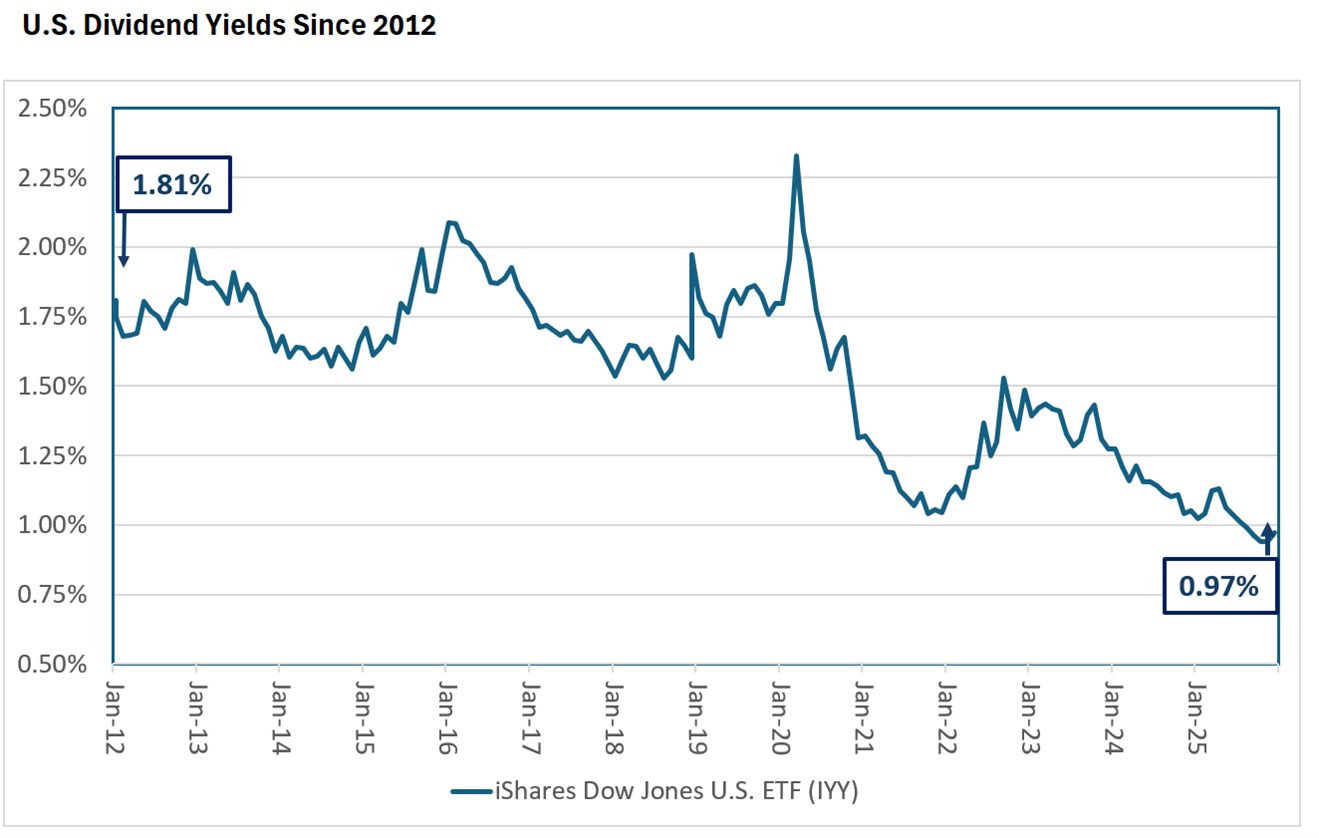
The stock market’s dividend yield has fallen below 1%. The large influence of technology-related stocks on the market is a major contributing factor. Share buybacks are also playing a role, though companies continue to grow their dividends.
Income-seeking investors should adjust their expectations for what a reasonable yield is accordingly. What was once a typical yield is now a high yield. High yields signal high perceived risk.
It is still very possible to do better than the market’s yield though. Our Dividend Investing (DI) portfolio, which seeks dividend growth stocks, yielded 2.4% at the end of 2025.
The chart below shows the monthly yields for the iShares Dow Jones U.S. ETF  (IYY), which is a broad market-weighted exchange-traded fund (ETF).
Source: QuoteMedia, BlackRock and AAII. Data as of 12/31/2025.
Bond Land Remains “Risk On”
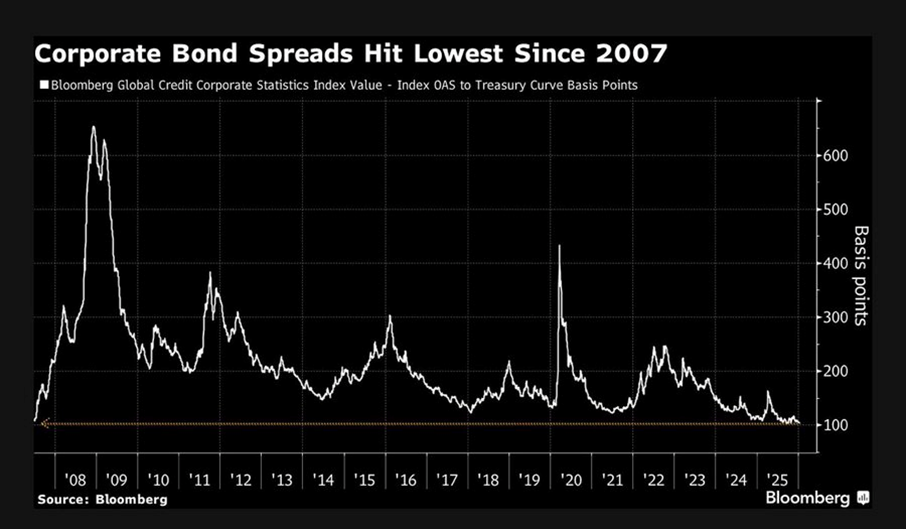
Last week, yield spreads narrowed to just 103 basis points (1.03%). Bloomberg, which Wharton School professor Mohamed A. El-Erian quoted when tweeting the chart below, described the spread between investment-grade and high-yield (“junk”) bond yields as being the narrowest since June 2007.
The narrower the spread in yields, the less you are compensated for taking on extra risk. Narrow spreads can signal optimism about economic conditions and/or a lack of worry about a bad event occurring in the foreseeable future.
International Stocks Outperformed Last Year
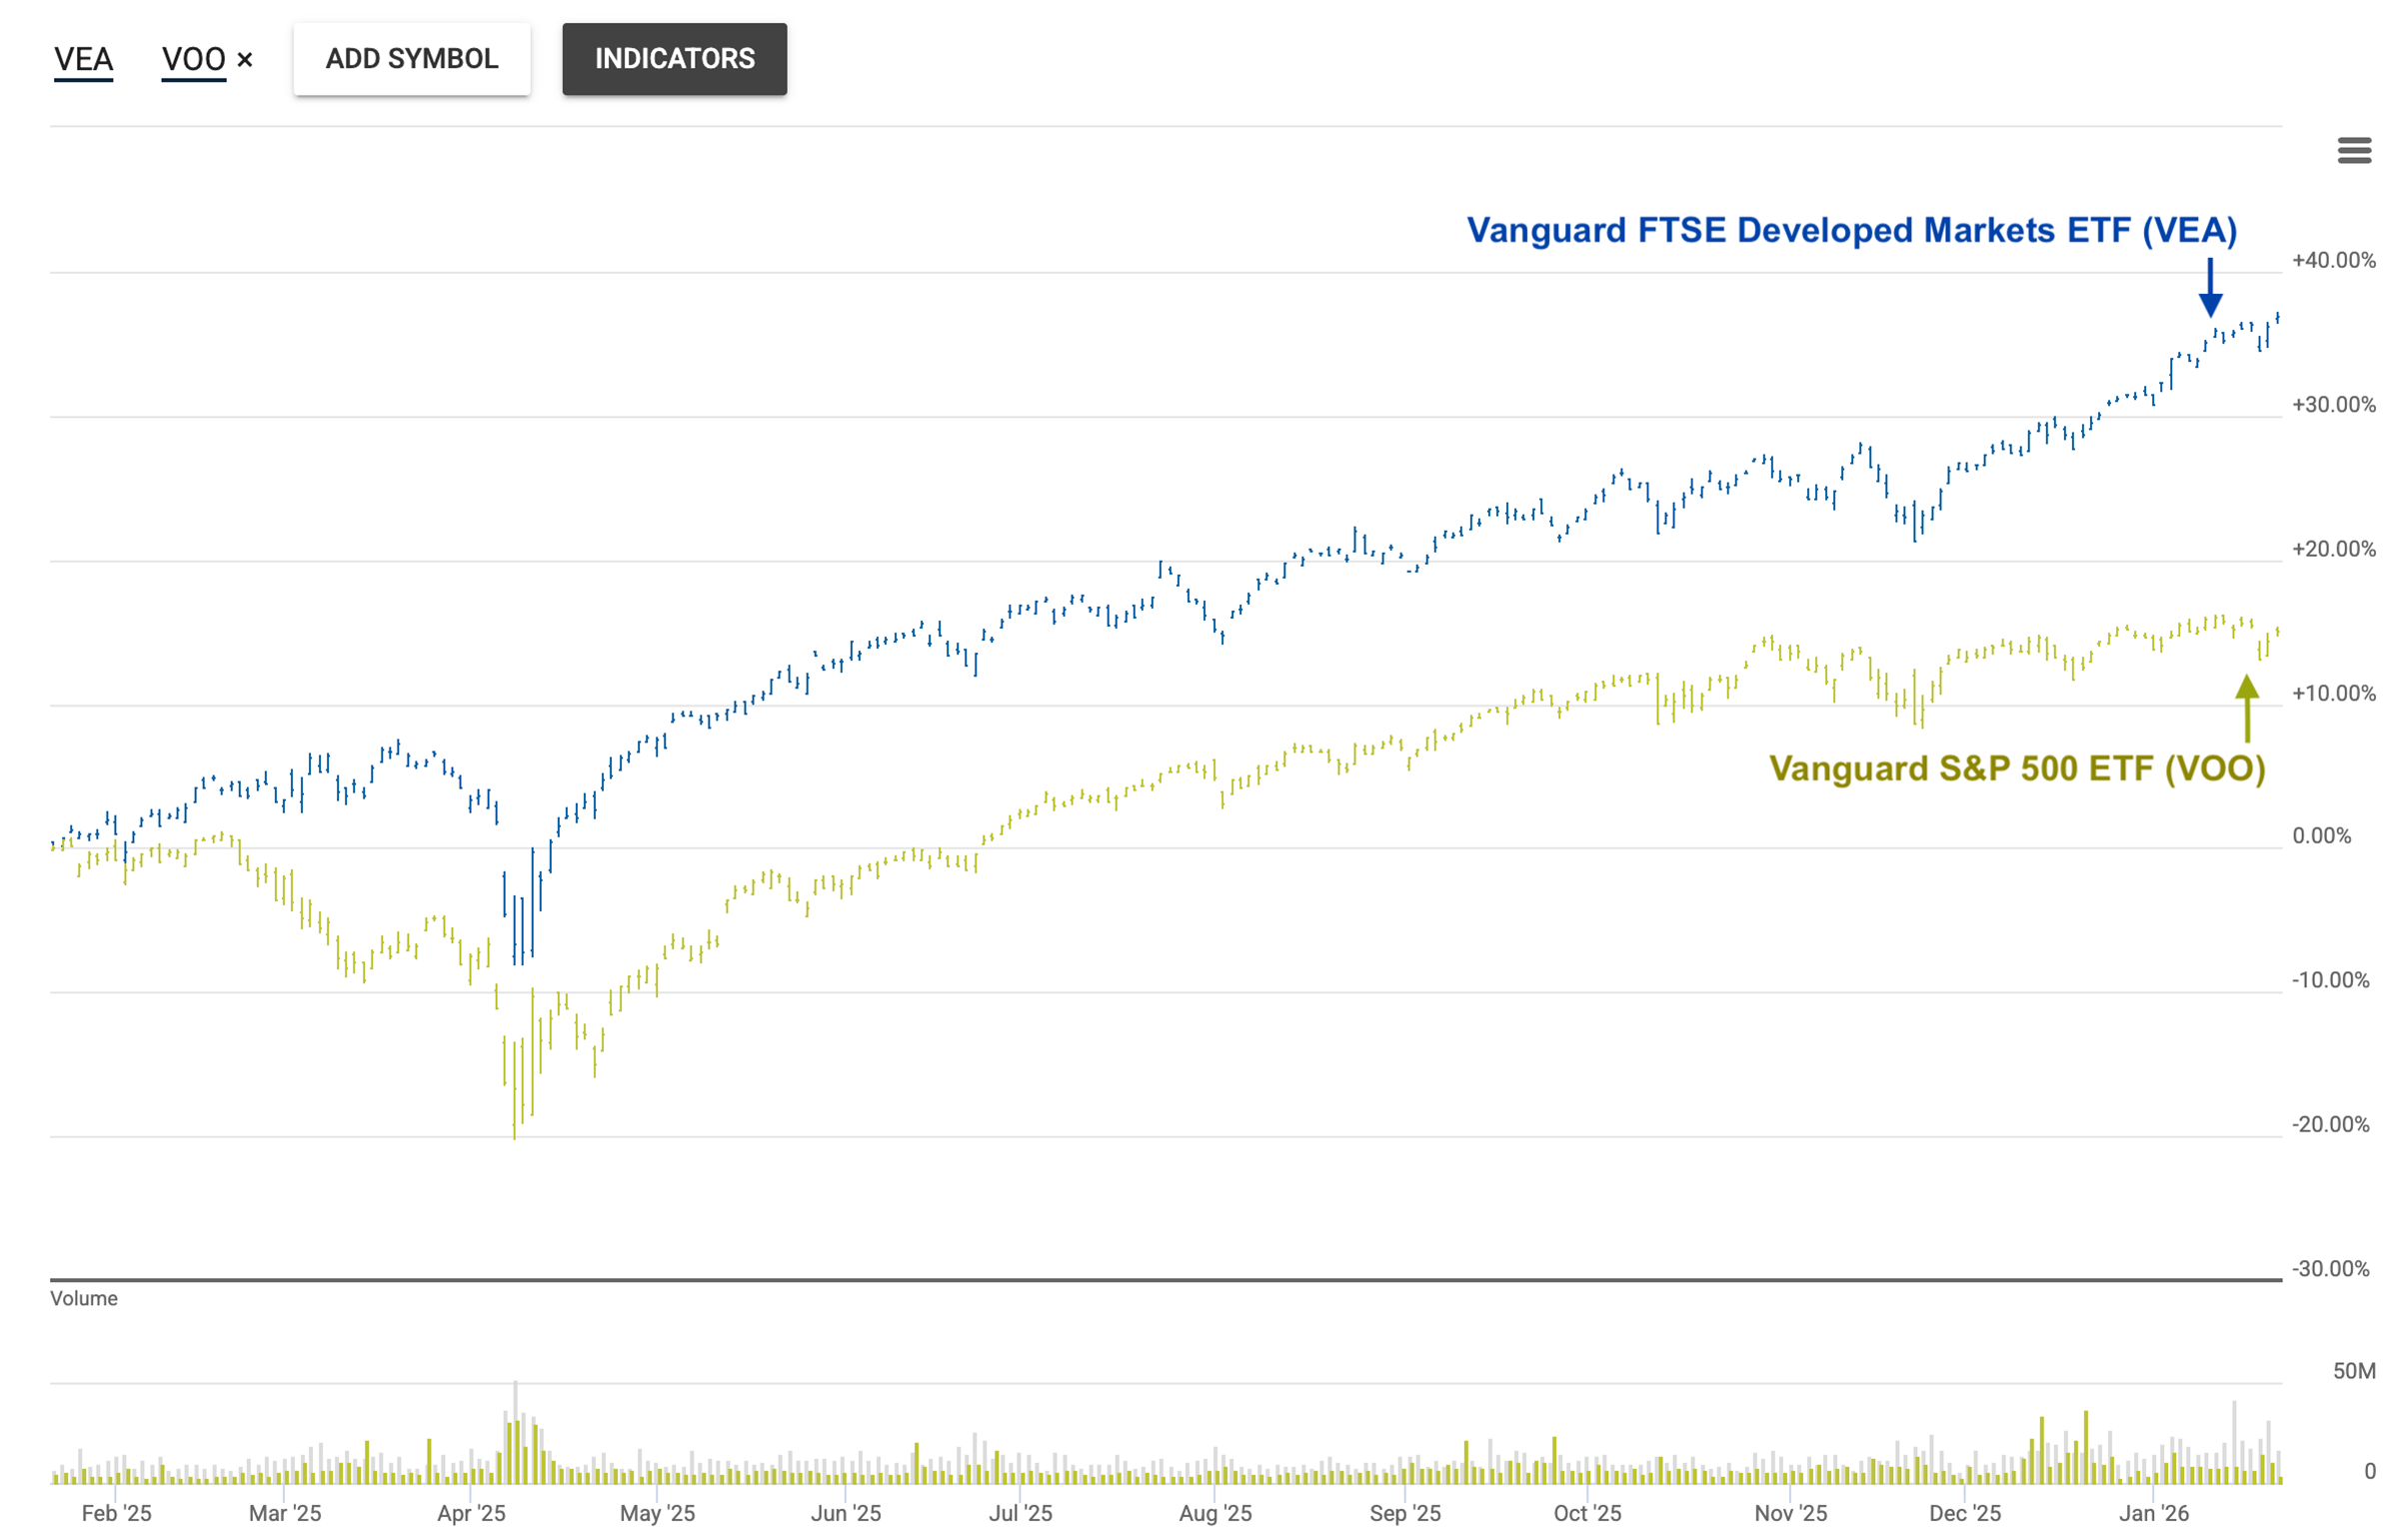
International stocks outperformed U.S. stocks last year for just the third time over the last 10 years. Credit the weaker U.S. dollar along with economic growth in foreign countries.
Since the chart below doesn’t start on January 1, 2025, I’ll share the return figures. The Vanguard FTSE Developed Markets ETF (VEA) jumped by 35.1% last year. The domestic Vanguard S&P 500 ETF trailed with a still good 17.8% return.
Momentum May Help Gold Keep Glittering
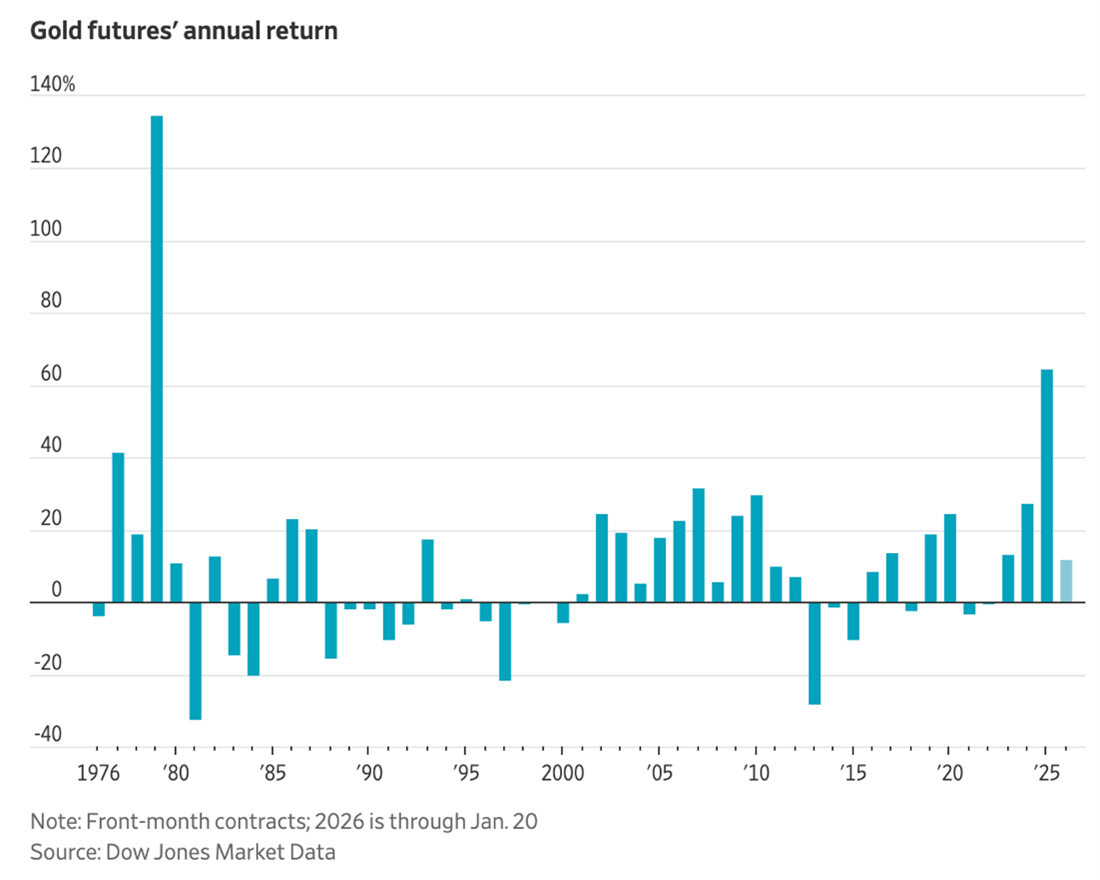
“In five of the six years before 2025 that gold futures rose by at least 20%, they climbed again the following year. And in those five years, the average increase was more than 15%,” reported The Wall Street Journal yesterday. The newspaper credited Citi analysts for the data.
I’ll add that price momentum has been found to exist in many different types of assets.
Reports of the Dollar’s Death Are Exaggerated
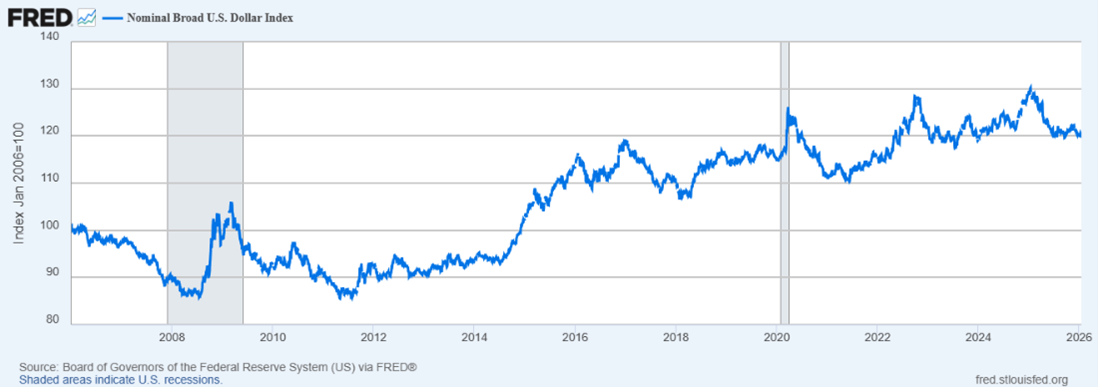
Soaring gold prices and increased geopolitical uncertainty have led to chatter about the U.S. dollar’s demise. While the greenback did weaken against a basket of currencies last year, it remains historically strong. As you can see in the chart below, the U.S. dollar has consistently traded at a premium for 11 consecutive years.
This isn’t to say there aren’t problems. One could rattle off a long list of U.S. fiscal issues. But other countries are having problems too. Plus, there isn’t a universally strong candidate to replace the U.S. dollar as the world’s reserve currency.
Cocoa Prices Are at a Two-Year Low
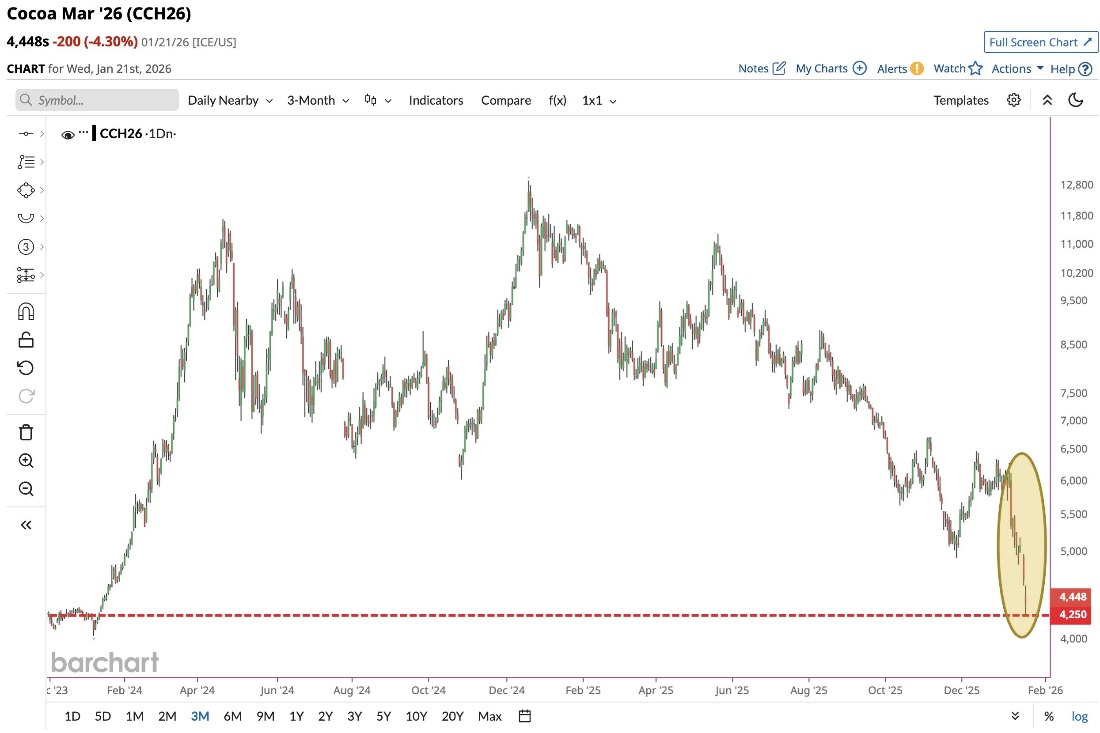
Chocolate lovers, rejoice! Cocoa prices hit a two-year low yesterday. Barchart cited two primary reasons for this. First, demand is “tepid,” with both European and Asian cocoa grindings down. (Grindings are a measure of how much cocoa is being processed.) Second, inventories are expected to rise thanks to improving conditions in key cocoa-producing West African countries.

-
Diversifying Your Dividends for Yield and Growth
Dividend investors can enhance yield, support growth and reduce risk by diversifying across sectors. -
Freedom-Focused Emerging Markets Fund Taps Into Local Growth
Freedom weighting results in lower autocracy risk and more sustainable growth in emerging markets. -
A One-Page Plan for Simplifying a Late-in-Life Portfolio
The January 2026 AAII Journal shows how the PRISM Wealth-Building Process provides a framework for thinking through what simplification looks like for you.
AAII Sentiment Survey
Optimism among individual investors about the short-term outlook for stocks decreased in the latest AAII Sentiment Survey. Meanwhile, both neutral sentiment and pessimism increased.
Bullish sentiment, expectations that stock prices will rise over the next six months, decreased 6.3 percentage points to 43.2%. Bullish sentiment is above its historical average of 37.5% for the eighth time in 11 weeks.
Neutral sentiment, expectations that stock prices will stay essentially unchanged over the next six months, increased 1.8 percentage points to 24.1%. Neutral sentiment is below its historical average of 31.5% for the 79th time in 81 weeks.
Bearish sentiment, expectations that stock prices will fall over the next six months, increased 4.5 percentage points to 32.7%. Bearish sentiment is above its historical average of 31.0% for the 47th time in 52 weeks.
The bull-bear spread (bullish minus bearish sentiment) decreased 10.8 percentage points to 10.4%. The bull-bear spread is above its historical average of 6.5% for the 12th time in 51 weeks.
This week’s special question asked AAII members what their performance forecast for the S&P 500 index is in 2026.
Here is how they responded:
- Up 10% or more: 25.6%
- Up between 2% and 9%: 43.5%
- Flat between +1% and –1%: 12.1%
- Down between 2% and 9%: 10.3%
- Down 10% or more: 7.2%
Bullish: 43.2%, down 6.3 points
Neutral: 24.1%, up 1.8 points
Bearish: 32.7%, up 4.5 points
Bullish: 37.5%
Neutral: 31.5%
Bearish: 31.0%
See more Sentiment Survey results.

January 15, 2026 Stock Market Returns Following Streaks of Double-Digit Gains
January 8, 2026 The New Features in Our Rebuilt My Portfolio
January 1, 2026 2025's Most-Read Investor Updates: The New Tax Law, Buffett and More
December 18, 2025 December Charts of Interest: Changes Among the Interest-Rate Setters

Discussion
Barry from TX posted 8 months ago:
Charles, #1Thanks for posting the Jan COI from your basement in chilly Chicago. Wayne and Garth started that way and made it big. #2 The AAII Investor-Market Sentiment Model reports that yield spreads dropped from about 3.5% in Jan 2025 to about 1% in Jan 26. #3 “When markets feel disconnected from economic reality, it’s natural to reach for frameworks that claim to explain what’s happening and what might come next.” // Below, I quote the Latest Fed Model Analysis from 1/21/2026. This demonstrates the value of this AAI Premium offering and provides insights into the history of the dynamics between market earnings yields and bond yields. The Fed Model, a YIELD SPREAD valuation tool, compares stock earnings to bond yields. It’s simple. It’s intuitive. It gets a lot of airtime in financial media. The article below offers a clear-eyed explanation of the Fed Model, how it works, when it has worked, and when it falls short. Whether you’re a DIY investor or a financial educator, this is your guide to interpreting what the Fed Model can—and cannot—tell us about markets today. /1/ [I have inserted hash marks to separate paragraphs due to the limitations of this posting program. “The market sits in an extraordinarily rare configuration that has appeared just 3 times in 673 months of data—a frequency of 0.45%. The January 2026 setup combines earnings yields @ 3.13% with Treasury yields @4.20%, a specific pairing that occurred only once before in modern history (August 2002, the last year of the dot com bubble). The mechanical drivers differ profoundly. In 2002, depressed earnings yields reflected collapsed corporate profits in the post-tech-bubble recession. In 2026, low earnings yields stem from expensive valuations during economic expansion, with the S&P 500 trading at nearly 32 times trailing earnings. /2/ “This creates an unstable equilibrium—expensive equity valuations existing alongside elevated risk-free rates. When we widen the lens slightly, requiring only that earnings yields fall below 3.25% while UST yields exceed 4.00%, we find this combination has materialized in just 32 of 673 months across 5 decades. This is not typical market behavior. It represents a fundamental contradiction: investors paying 32x earnings for stocks while UST10 yield 4.20% SIGNALS competing narratives about future returns. /3/ “The Fed Model's 1.7th percentile ranking on a 10-year lookback confirms this represents a historical extreme, with strong agreement across all timeframes. Both 1-year and 5-year percentiles cluster in the low single digits, indicating this is not a fleeting aberration but a sustained state of bond preference over equities. The three-month duration in Very Low territory marks the first extended period at these levels since early 2024. /4/ “Historical resolution patterns favor Treasury yield movement over earnings yield adjustment. When August 2002's comparable configuration resolved over the subsequent six months, Treasury yields fell 36 basis points while earnings yields rose just 34 basis points—the bond market moved first. This makes intuitive sense: monetary policy and rate expectations shift faster than corporate valuations compress or earnings growth accelerates. /5/ “Forward return analysis from 145 comparable periods shows modest average outcomes—just 6.05% over 12 months—but with extraordinary dispersion ranging from -38% to +52%. The widespread reflects the volatile nature of extreme Fed Model readings. Recent 2020s data shows unusual resilience with 100% win rates and 20% average returns, though this coincides with unprecedented monetary and fiscal stimulus that may not repeat. /6/ “The Fed Model practical monitoring framework centers on one variable: UST10 yields. A sustained break below 3.85-4.00% would validate current equity valuations by making the earnings yield gap acceptable. /7/ “Conversely, a move above 4.40-4.50% would intensify fundamental tension, likely forcing equity repricing. /8/ At 4.20%, we sit in the middle of this critical range. The market cannot maintain expensive valuations alongside elevated rates indefinitely—one must give way. History suggests the Treasury yield resolves this contradiction before equity multiples adjust meaningfully.” /END/ I hope this helps you understand why Charles made the interplay of market EPS yields and UST yields the lead story in this COI. Regards.
Barry from TX posted 8 months ago:
Charles, #1 comparative data helps me understand “eye candy” statistics so I can place the data in context. #2 This enables me to compare prior (historical) probabilities and to estimate post (Bayesian) probabilities. Like the Reverend Bayes, I want to know where the most recent snooker ball (my estimate) is on the snooker table (the sample space) and how the most recent changes impact "the angle" I choose for my next shot. #3 Such data would have enabled interested AAII members (or maybe just me) to place the AAII member estimated projections solicited for the 2026 market into context. #4 With these data, members can estimate (maybe just eyeball) how good (or as lucky as a blind chimp throwing darts) we are at forecasting. #5 Charles, is there any chance of a follow-up post with these data or a reference to some? #6 Better yet, in the future, can you make comparative data for AAII member forecasts an "improvement' when you report future member data so members can have feedback on their forecasting capabilities and improve their accuracy (or not). #7 I would settle for historic SDs. I can do the math from there. Regards.
You need to log in as a registered AAII user before commenting.
Create an account