

Extreme Accounting Numbers Deserve a Closer Look
by Charles Rotblut | July 09, 2026
Earnings persistency is one of the stock characteristics that our A+ Investor Quality Grade takes into consideration. Specifically, the Quality Grade looks at how reliant a company is on accruals to boost its earnings. This reliance matters because it indicates whether a company has a greater risk of writing down earnings in the future.
Accrual accounting recognizes transactions when their economic benefits become probable. This practice makes corporate earnings easier to forecast since they aren’t dependent on how quickly or slowly customers pay their invoices. It would be very difficult to forecast earnings for a specific period if corporations used cash accounting.
Risks arise when current earnings are more attributable to accruals than to cash flow. When earnings exceed operating cash flow, they are less likely to persist in the future—a factor known as the “accrual anomaly.” This is because the changes in current accruals are primarily attributable to changes in accounts receivable (money owed by customers) and inventories. These two balance sheet items are subjective and require management projections about what will likely occur in the future.
The notion of the accrual anomaly is credited to University of California, Berkeley, accounting professor Richard Sloan. Sloan’s research showed that companies with low accruals outperform, while companies with high accruals underperform. Follow-up studies found that profits from using the anomaly are most likely to be realized in stocks with lower levels of volume. These are the same stocks that have high trading costs for institutional traders.
Recent research suggests that the picture is more complex. University of Oklahoma professor C.S. Agnes Cheng and University of Central Arkansas professor Jing Fang found the link between accruals and stock returns to be even more nuanced than Sloan documented. In a recently released working paper, they demonstrate that both very high and very low accruals are associated with more severe mispricing.
Companies with the lowest 20% and the highest 20% of accruals are mispriced more severely than companies whose accruals are closer to the median. Extreme-accrual companies tend to be smaller, younger and more operationally volatile. Their historical financials do a worse job of predicting future earnings. Analyst forecasts for these companies are more dispersed and less accurate. Institutional investors own less of these stocks, and fewer analysts cover them.
This combination makes such stocks harder to value. Furthermore, when pricing mistakes occur, those mistakes get corrected more slowly. How this gets reflected in returns depends on whether a stock is undervalued or overvalued to begin with. The mispricing produces two distinct patterns.
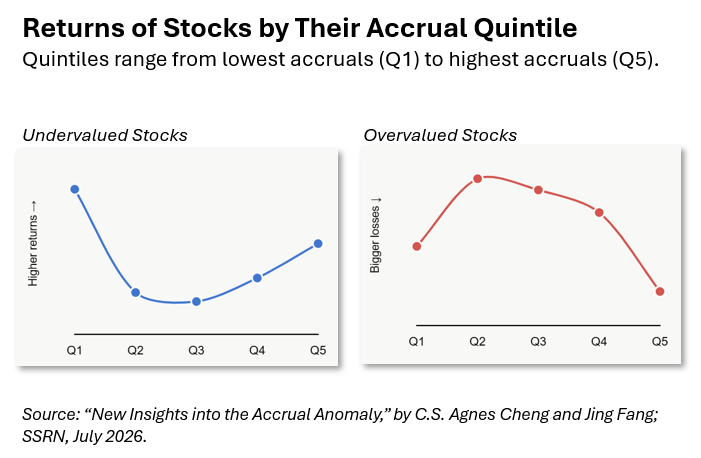
First, undervalued stocks experience U-shaped returns based on their level of accruals. The highest returns are realized by stocks with the lowest amount of accruals. Returns decrease toward the middle quintiles, before rising again for stocks whose accruals rank in the top 20%. Note that the stocks with the lowest level of accruals still outperform the stocks with the highest level of accruals.
Second, overvalued stocks experience inverted U-shaped returns based on their level of accruals. The least negative returns are realized by stocks in the middle quintiles. Stocks whose accruals rank in the lowest or highest 20% have worse returns than those in the middle, with the highest-accrual stocks experiencing the most negative returns. All returns here are negative because these are overvalued stocks; the correction means that they earn negative future returns as the mispricing gets fixed.
The practical takeaway is that unusual accounting numbers—at either extreme—deserve extra scrutiny. A company reporting exceptionally clean earnings might be a bargain, or it might be a smaller, less-followed firm whose financials are harder to read than they appear. The same caution applies to a company whose reported earnings look unusually strong on paper but aren’t backed by operating cash flow.

-
Using Accruals to Judge How Persistent Earnings Will Be
Accruals can be described as forecasts of future economic benefits; if they are too optimistic, future earnings will be reduced. -
Detecting Earnings Manipulation With the M-Score
The eight variables in the M-Score model are designed to capture bloating or cosmetic changes made to a company’s financial statement numbers. -
It’s Time for Your Midyear Financial Checkup
Use this convenient midyear checklist from the new July 2026 AAII Journal to keep your finances on course.
AAII Sentiment Survey
Pessimism among individual investors about the short-term outlook for stocks decreased in the latest AAII Sentiment Survey. Meanwhile, optimism and neutral sentiment increased.
Bullish sentiment, expectations that stock prices will rise over the next six months, increased 4.9 percentage points to 36.3%. Bullish sentiment is below its historical average of 37.5% for the seventh time in eight weeks.
Neutral sentiment, expectations that stock prices will stay essentially unchanged over the next six months, increased 0.1 percentage points to 26.5%. Neutral sentiment is below its historical average of 31.5% for the 103rd time in 105 weeks.
Bearish sentiment, expectations that stock prices will fall over the next six months, decreased 5.1 percentage points to 37.2%. Bearish sentiment is above its historical average of 31.0% for the 22nd consecutive week.
The bull-bear spread (bullish minus bearish sentiment) increased 10.0 percentage points to –0.9%. The bull-bear spread is below its historical average of 6.5% for the 20th time in 22 weeks.
This week’s special question asked AAII members how the stock market’s year-to-date return compares to their expectations at the start of 2026.
Here is how they responded:
- It is better than I expected: 70.1%
- It is about as I expected: 22.8%
- It is worse than I expected: 4.9%
- Not sure/other: 1.6%
Bullish: 36.3%, up 4.9 points
Neutral: 26.5%, up 0.1 points
Bearish: 37.2%, down 5.1 points
Bullish: 37.5%
Neutral: 31.5%
Bearish: 31.0%
See more Sentiment Survey results.

July 2, 2026 The Stock Market at Midyear: Big Gains Fueled by Earnings Growth
June 25, 2026 What Makes Perpetual Futures So Risky?
June 18, 2026 June Charts of Interest: A New Fed Chair and Rising Rate Expectations
June 11, 2026 Three Ways to Diversify From a Top-Heavy S&P 500

Discussion
Barry from TX posted 2 months ago:
Charles, the way I understand it, the AAII Grades scoring system uses normalized data to rank the distributions. Normalization compresses the spread in the data. How does the AAII Grading system "inspect" the grades to ensure that "outlier" data points or "long trails" are reviewed to explain the possibility of these anomalies?
John O'Keefe from Texas posted 2 months ago:
Charles You can mitigate this problem very simply by replacing the phoney baloney Income numbers with Free Cash Flow. Accountants & Management teams manipulate book income all the time. Not so with Free Cash Flow as there is no angle from which they can can change it for timing or geography reasons! Best, John
You need to log in as a registered AAII user before commenting.
Create an account