

Despite the Headlines, Mr. Market Is Quite Content
by Charles Rotblut | January 23, 2020
The current headlines sound like something that would be included in the lyrics of a follow-up song to Billy Joel’s “We Didn’t Start the Fire” or R.E.M’s “It’s the End of the World.” There are threats of new tariffs against our European allies. The impeachment proceedings have started in the U.S. Senate. Australia is burning. The Wuhan coronavirus is spreading in China just as the Lunar New Year is about to be celebrated. Iran is believed to be considering a cyberattack. Brexit is going to happen, and political jabs are being thrown in Davos.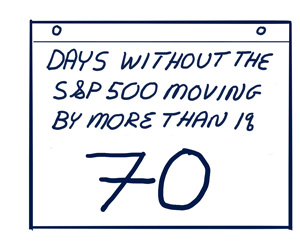
Yet, in the midst of all this, Mr. Market is quite content. The S&P 500 index has not experienced a daily move greater than 1% since October 11, 2019. The current streak of 70 days with low volatility is among the 10 longest such streaks since 1969, according to The Wall Street Journal.
As I explained in last Friday’s VMQ Stocks weekly update, the current low volume streak started at the same time that U.S. President Trump and Chinese President Xi Jinping reached a truce in the trade war. President Trump announced the leaders’ intention to sign a phase-one trade deal on October 11, 2019. Since then, the stock market has been calm and the large-cap indexes have gradually risen to ever-higher record closes.
Traders seem to be pricing in improved visibility or, at least, less fear about the status of trade between the U.S. and China. They are also downplaying the possibility of new tariffs on European goods. Expectations for earnings to grow and for the Federal Reserve to remain hesitant about raising interest rates could also be factors. We never know the actual reasons with absolute certainty.
Regardless of why it is happening, a period of gradually rising prices and low volatility certainly won’t draw complaints from investors. Whether this streak means we’re in for another year like 2017 when volatility was very low is unknown. It’s still January; most of 2020 has yet to unfold.
It’s fine to keep your fingers crossed as long as you don’t let the current calm lull you into veering from your strategy. As many of you know, we at AAII encourage investors to look past shorter-term market movements and focus on their long-term goals. Those who stick with their strategies during periods of both calm and turbulence realize greater long-term wealth than those who make changes based on Mr. Market’s mood.

-
You Can Judge a Fund by Its Volatility – Though conditions are calm now, actively managed funds with previously high levels of volatility will likely return to being volatile once market conditions change.
-
Data Mixed on Whether Volatility Is Rising – When volatility is looked at on a monthly—instead of on a daily—basis, there is no clear evidence that it has risen over the past 80 years.
Optimism among individual investors about the short-term direction of the stock market reached a 15-month high in the latest AAII Sentiment Survey. Meanwhile, both neutral and bearish sentiment declined.
Bullish sentiment, expectations that stock prices will rise over the next six months, rose 3.8 percentage points to 45.6%. Optimism was last higher on October 3, 2018 (45.7%). The historical average is 38.0%.
Neutral sentiment, expectations that stock prices will stay essentially unchanged over the next six months, declined 1.0 percentage points to 29.6%. This is the first time in a year that neutral sentiment is below its historical average of 31.5% on back-to-back weeks.
Bearish sentiment, expectations that stock prices will fall over the next six months, fell 2.7 percentage points to 24.8%. The drop keeps pessimism below its historical average of 30.5% for the 14th consecutive week.
All three indicators are currently well within their typical historical ranges.
Optimism is above its historical average for the fourth time in six weeks. Whether this is a shift in trend remains to be seen. Bullish sentiment has not stayed above its historical average for a period of longer than two consecutive weeks since September 2018. It has not had a streak of above-average readings lasting more than three consecutive weeks since January 2018.
The market’s upward trend combined with low volatility and the phase-one trade deal between the U.S. and China are contributing to the higher level of individual investor optimism. Also influencing expectations about the direction of stock prices are the November elections, Washington politics, earnings growth, monetary policy, the economy and valuations.
For this week’s special question, we asked AAII members how they think the trade agreement between the U.S. and China will impact stock prices going forward. While results of the survey show that a majority (70%) believe the trade agreement will have a positive impact, most of these respondents state that the positive impact will be short-lived unless further progress is made. On the other hand, 26% of all respondents believe that the trade agreement will not have a material impact on stock prices.
Here is a sampling of the responses:
- “Long-term, stock prices will be up. Agriculture purchases and increased production to other industries will be a major contributor going forward.”
- “No immediate impact. I believe the impact of the trade agreement is already priced into the market. There will possibly be a negative impact going forward if China doesn’t hold up their end of the agreement.”
- “It will have a moderate impact but will only be sustained by further progress. Ultimately the market will be disappointed if progress does not continue.”
- “I have no idea. What China actually does is (or should be) more important than what is written in an agreement when determining what one is willing to pay for a specific company’s stock.”

Bullish: 45.6%, up 3.8 points
Neutral: 29.6%, down 1.0 points
Bearish: 24.8%, down 2.7 points
Bullish: 38.5%
Neutral: 31.0%
Bearish: 30.5%
January 16, 2020 The New Features We’ve Added to Our Website
January 9, 2020 Part 2 of My Investing Resolutions for 2020
January 2, 2020 My Investing Resolutions for 2020, Part 1
December 19, 2019 Spending Bills Affect Inherited IRAs and Medical Deductions

Discussion
James E. Morlan from Colorado posted over 6 years ago:
I can not locate the article you all wrote on Home Depot reguarding it's high debt to capitalization ratio. It seems that the high debt wsa not that much of a problem because the interest rate they were paying was not very high. You may have called it the Interest Coverage Ratio. May I ask you for that article or you tell me how to locate the article? Thanks Jim Morlan
You need to log in as a registered AAII user before commenting.
Create an account