

Optimism Has Been Low This Year, but Not Unusually So
by Charles Rotblut | December 14, 2017
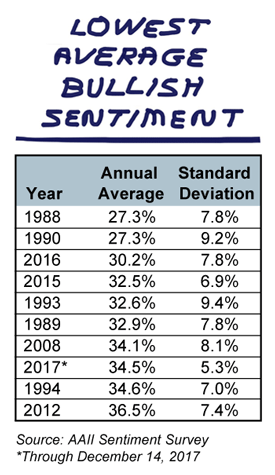
This week notwithstanding, optimism about the short-term direction of the stock market has been below average for 40 out of 50 weeks this year in our AAII Sentiment Survey. Given this trend, I was curious as to how 2017 compares to the 30 previous years tracked by our survey. So, I updated the historical analysis I’ve been keeping on unusually high and low readings (see the table at the end of this commentary) and then conducted calendar-year analysis.
Year to date, bullish sentiment is averaging 34.5% (including this week’s latest reading of 45.0%). Historically, bullish sentiment has averaged 38.5% over the life of our survey. (The average is technically 38.27%, but investing is messy and rounding works well enough.) Relative to the other 30 calendar years we have survey data for, 2017 ranks eighth in terms of having the lowest average bullish sentiment.
As you can see on the table located to the right, 1988 and 1990 had the lowest average levels of optimism at 27.3% each. Notably, in third and fourth place were 2016 and 2015. Not shown in the table are the years with the highest level of average bullish sentiment: 2000 (49.4%), 2004 (49.0%) and 2003 (48.4%).
While average bullish sentiment has not been exceptionally low this year, its weekly readings have been comparatively stable. When I calculated the standard deviation (a measure of variance) on a calendar-year basis, this year ranked as the second lowest. The year with the lowest level of standard deviation was 1995, with a standard deviation of 5.2%. This year may actually be tied for the lowest because prior to 2000 the weekly readings were rounded to whole numbers (we used to conduct the survey by mailing out postcards.) Now, members vote online and the results are automatically tabulated by a database. The report we see internally goes out to four decimal places.
The low level of variance in our survey has occurred at the same time volatility in the stock market has been historically low. The CBOE’s Volatility Index (aka, the “VIX”) has averaged 11.14 year to date. The next least volatile year was 1994, when the VIX’s average reading was more than a full point higher at 12.69. To give some context to these numbers, since 1990, the VIX has had an average daily reading of 19.38 and a median daily reading of 17.52.
For those of you who are curious, the year with the greatest variance in bullish sentiment was 2003. Bullish sentiment swung that year from a low of 21.1% on February 20, to a high of 71.4% on June 26. The big swing occurred as the post-dotcom bear market bottomed and stocks rebounded strongly. [This year, optimism has ranged from 23.9% (May 18) to 46.2% (January 5).]
The calendar-year averages are interesting and provide some color, but where our survey has the strongest link with market returns is when sentiment reaches extremes. Specifically, when bullish sentiment falls to an unusually low level, the S&P 500 has historically outperformed. As the table below shows, the large-cap index has risen by an average of 7.4% over the following six-month period whenever bullish sentiment has been more than one standard deviation below its historical average. (Currently, a reading below 28.0% would be unusually low.)
Conversely, whenever optimism is too high, stocks tend to underperform. The S&P 500 has realized an average six-month return of just 2.8% whenever bullish sentiment has been more than one standard deviation above its historical average. (Readings above 48.5% would be unusually high based on the current range.)
Despite suggestions for buying “when there’s blood on the streets,” analysis of our survey’s history suggests that buying when everybody else is gloomy about future returns is a better strategy. You should not, however, base your portfolio decisions off of our or anybody else’s survey data. Though a link exists, it is not causal. Rather, use unusually high or unusually low bullish sentiment as a sign to check other factors (e.g., valuations) and to see if your portfolio needs to be rebalanced.
Performance of the AAII Sentiment Survey without Hindsight
| Bullish | Neutral | Bearish | Bull 8-wk | Bear 8-Wk | B/B Spread | S&P 500 | |
| +1 Standard Deviation above Average, 26-week Returns | |||||||
| Average | 2.8% | 4.7% | 4.5% | 2.6% | 4.9% | 3.5% | 4.4% |
| Median | 3.8% | 5.3% | 5.7% | 3.0% | 6.7% | 4.0% | 5.3% |
| Periods with Gains | 215 | 95 | 197 | 219 | 245 | 188 | 1148 |
| Periods with Losses | 81 | 31 | 99 | 94 | 116 | 66 | 404 |
| Total Count | 296 | 126 | 296 | 313 | 361 | 254 | 1552 |
| Percent Contrarian | 27.4% | 75.4% | 66.6% | 30.0% | 67.9% | 26.0% | |
| Contrarian Movement | Losses | Gains | Gains | Losses | Gains | Losses | |
| -1 Standard Deviation above Average, 26-week Returns | |||||||
| Average | 7.4% | 2.1% | 3.8% | 7.2% | 4.0% | 5.5% | 4.4% |
| Median | 6.9% | 3.1% | 4.4% | 6.6% | 4.5% | 6.5% | 5.3% |
| Periods with Gains | 144 | 240 | 126 | 147 | 130 | 177 | 1148 |
| Periods with Losses | 34 | 145 | 47 | 34 | 50 | 66 | 404 |
| Total Count | 178 | 385 | 173 | 181 | 180 | 243 | 1552 |
| Percent Contrarian | 80.9% | 37.7% | 27.2% | 81.2% | 27.8% | 72.8% | |
| Contrarian Movement | Gains | Losses | Losses | Gains | Losses | Gains | |
| +1 Standard Deviation above Average, 52-week Returns | |||||||
| Average | 5.7% | 11.9% | 7.6% | 5.7% | 8.4% | 6.9% | 9.2% |
| Median | 7.7% | 12.4% | 12.1% | 7.7% | 12.4% | 8.4% | 10.9% |
| Periods with Gains | 217 | 101 | 210 | 233 | 260 | 193 | 1212 |
| Periods with Losses | 79 | 23 | 85 | 80 | 100 | 61 | 314 |
| Total Count | 296 | 124 | 295 | 313 | 360 | 254 | 1526 |
| Percent Contrarian | 26.7% | 81.5% | 71.2% | 25.6% | 72.2% | 24.0% | |
| Contrarian Movement | Losses | Gains | Gains | Losses | Gains | Losses | |
| -1 Standard Deviation above Average, 52-week Returns | |||||||
| Average | 13.2% | 2.9% | 7.5% | 13.5% | 10.6% | 9.3% | 9.2% |
| Median | 16.0% | 7.1% | 9.0% | 15.3% | 11.9% | 15.2% | 10.9% |
| Periods with Gains | 148 | 243 | 130 | 163 | 145 | 183 | 1212 |
| Periods with Losses | 27 | 142 | 43 | 18 | 35 | 56 | 314 |
| Total Count | 175 | 385 | 173 | 181 | 180 | 239 | 1526 |
| Percent Contrarian | 84.6% | 36.9% | 24.9% | 90.1% | 19.4% | 76.6% | |
| Contrarian Movement | Gains | Losses | Losses | Gains | Losses | Gains | |
| Source: AAII Sentiment Survey; Data from June 24, 1987 through December 7, 2017 | |||||||

- Analyzing the AAII Sentiment Survey Without Hindsight – I discussed how we determine what an unusually high or low reading is, and our rationale for doing so, in this 2014 AAII Journal article. The data is older, but the explanations remain valid.
- Investment Sentiment Indicators: Quite Contrary? – In this 2004 AAII Journal article, Mark Hulbert discussed the history of sentiment indicators and made observations on their usefulness.
Optimism among individual investors about the short-term direction of the stock market is at a five-week high. The latest AAII Sentiment Survey also shows declines in the proportion of individual investors describing their short-term outlook as being “neutral” or “bearish.”
Bullish sentiment, expectations that stock prices will rise over the next six months, jumped 8.1 percentage points to 45.0%. Optimism was last higher on November 9, 2017 (45.1%). This is the first time in five weeks that bullish sentiment is above its historical average of 38.5%.
Neutral sentiment, expectations that stock prices will stay essentially unchanged over the next six months, fell 2.0 percentage points to 26.9%. Neutral sentiment was last lower on November 2, 2017 (26.4%). The historical average is 31.0%.
Bearish sentiment, expectations that stock prices will fall over the next six months, plunged 6.1 percentage points to 28.1%. Pessimism was last lower on November 9, 2017 (23.1%). The historical average is 30.5%.
Bullish sentiment is above its historical average for just the 10th week this year. Though optimism has been below average for much of the year (an average reading of 34.5%), 2017 has not been a year of excessively low optimism. Rather, this year is on track to rank eighth (out of 31) in terms of having the lowest average calendar-year bullish sentiment reading.
Most of this week’s results were recorded before the outcome of Alabama’s special election were known and yesterday’s Federal Open Market Committee meeting statement and committee member forecasts were released. Our previous polling of individual investors shows that most are not currently making investment decisions based on the pending tax legislation. While some of our members are optimistic about the prospects of tax reform being passed, about 40% of those polled in a different weekly AAII survey said the proposed legislation could hurt them.
This year’s record highs for the major U.S. stock indexes have encouraged some individual investors, though others have expressed concerns about the possibility of a pullback or a more severe drop occurring. Also affecting investor sentiment are earnings growth, economic growth, valuations and the lack of volatility. Washington politics remains at the forefront of many individual investors’ minds.
This week’s special question asked AAII members how they perceive the performance of the stocks they own or follow relative to the year-to-date returns of the S&P 500 index and the Nasdaq composite. Slightly more than 37% of respondents said their returns are close to the major indexes, are beating the S&P 500 but not the Nasdaq, or have some stocks that are beating the indexes and some that are trailing. Approximately 35% say they are either beating one or both of the aforementioned indexes or otherwise happy with their year-to-date returns. Just under 26% say they are underperforming, though many of these respondents explained they are using more conservative allocations or are focused more on value stocks, which have lagged growth stocks year to date.
Here is a sampling of the responses:
- “My stocks have done well overall, exceeding the S&P 500.”
- “Some stocks are above the S&P 500 and the Nasdaq, while some are below.”
- “About the same. Roughly in line with the market’s gains.”
- “I have performed lower due to a value-based stock selection strategy.”
- “Mine will underperform both of those indexes, but will be less volatile.”
- “I follow AAII’s Model Shadow Stock portfolio. The performance is above expectations.”

Bullish: 45.0%, up 8.1 points
Neutral: 26.9%, down 2.0 points
Bearish: 28.1%, down 6.1 points
Bullish: 38.5%
Neutral: 31.0%
Bearish: 30.5%
December 7, 2017 Investors, Turn Down the Volume
November 30, 2017 The Senate’s Proposed Change to Recognizing Capital Gains
November 23, 2017 Reasons for Individual Investors to Be Grateful
November 16, 2017 Choosing Between a Traditional and a Roth IRA

Discussion
No comments have been added yet. Add your thoughts to the discussion!
You need to log in as a registered AAII user before commenting.
Create an account