

The 60/40 Strategy Has Worked Even When Bond Returns Have Disappointed
by Charles Rotblut | October 17, 2019
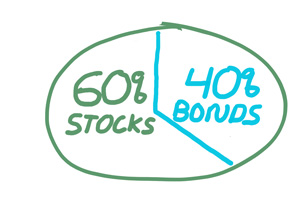
Historically, the simple allocation strategy of 60% large-cap stocks and 40% bonds has been a tough benchmark to beat. Not impossible, but tough. I like to refer to it as the Subaru station wagon of allocation strategies. It’s not flashy, but it has a record of reliability, it’s suitable for a large number of people and while it can’t fully protect you from a crash, it will hold up a lot better than many other strategies.
Between 1927 and 2018, the 60/40 portfolio has returned a respectable 8.5% on an annualized basis based on data from the Ibbotson SBBI Yearbook and our calculations. Though below the 10.0% annualized gain realized by an all large-cap stock portfolio, its volatility has been 40% less. In terms of maximum loss, the 60/40 portfolio’s worst calendar year was 1931 when it lost 26.9%. This was a far more tolerable decline than the 43.3% tumble large-cap stocks incurred. The 60/40 allocation has also had four more positive (and therefore four fewer negative) calendar years with positive returns (71 out of the last 92).
 For retirees, the 60/40 strategy works well with the 4% withdrawal rule. Assuming a person withdrew 4% of their savings balance during the first year of retirement and then adjusted the initial dollar amount upward each year for retirement, they would have most likely had wealth left to pass along to their heirs. Even at retirement periods spanning 40 years, a retiree combining the 60/40 portfolio allocation with a 4% withdrawal rate would have money left over 87% of the time. For retirement periods lasting between 15 and 35 years, the success rates ranged between 100% and 93%. Those are good odds.
Still despite these positives, one big question stands out right now: What about the big bond allocation? What happens if bond returns are well below average going forward? I ran some numbers to find out.
There has been only one 20-year period over the last 92 years where annual bond returns mostly stayed below 3%: 1940–1959. During this period, there were 13 calendar years when intermediate-term government bonds realized a gain of less than 2%. During eight of those years, returns were less than 1%. Furthermore, the only years during this period when bond returns exceeded 3% were 1953 (up 3.2%) and 1957 (up 7.8%).
This period happened to be a very good one for stocks. Large-cap stocks realized a 14.1% annualized gain. The large gain more than offset the lackluster returns bonds realized. Thus, not only did the 60/40 portfolio realize a 9.9% annualized gain, it enabled a retiree to have far more wealth at the end of 1959 than they started with in 1940 even after withdrawals are accounted for. A $100,000 retirement portfolio at the beginning of 1940 was worth $245,500 at the end of 1959 with nearly $128,000 in withdrawals taken over the 20-year period.
An alternative analysis would involve looking at the years when the 60/40 portfolio incurred negative returns. There were 21 such years. During all but one of the years, stock prices declined in value. The only year when large-cap stocks rose but the 60/40 portfolio fell was 1994. Large-cap stocks rose by 1.3% while intermediate-term government bonds fell 5.1%.
None of this to say the 60/40 allocation is right for every person. There are strategies with higher levels of long-term returns, larger amounts of income or less volatility. More importantly, allocation is very personal; what is right for one person can be very wrong for someone else. What the numbers do show is a historical record of the strategy holding up even when bond returns have been disappointing.

-
The Advantages of Simple Allocation Strategies – Though complex strategies may sound intriguing, they often don’t outperform simple strategies like a 60/40 allocation, as Wesley Gray explained.
-
Basic Truths About Asset Allocation: A Consensus View Among the Experts – Though written in 1996, many of the insights provided in this AAII Journal article continue to remain true today.
Optimism among individual investors about the short-term direction of the stock market surged, while pessimism plunged in the latest AAII Sentiment Survey. Neutral sentiment is modestly lower.
Bullish sentiment, expectations that stock prices will rise over the next six months, rebounded by 13.3 percentage points to 33.6%. Even with the big increase, optimism remains below its historical average of 38.0% for the 34th time this year and the 22nd time in 23 weeks.
Neutral sentiment, expectations that stock prices will stay essentially unchanged over the next six months, declined 0.4 percentage points to 35.3%. Neutral sentiment is above its historical average of 31.5% for the 21st time in 22 weeks.
Bearish sentiment, expectations that stock prices will fall over the next six months, pulled back by 12.9 percentage points to 31.1%. Bearish sentiment is above its historical average of 30.5% for the 11th time in 13 weeks.
All three indicators are back within their historical ranges.
This week’s big moves occurred as the S&P 500 index recouped its losses from earlier in the month. In addition, the shift in bullish and bearish sentiment back toward their historical averages follows what had been an unusually low level of optimism and an unusually high level of pessimism.
Many individual investors have been monitoring trade negotiations, particularly between the U.S. and China. Also having an influence on sentiment are Washington politics, geopolitics, valuations, corporate earnings, economic growth, monetary policy and interest rates.
This week’s special question asked AAII members what they perceive as the biggest risk currently facing the market. The range of responses was far and wide. Approximately 38% of respondents name geopolitical uncertainty as the biggest risk to the market, particularly the ongoing trade war with China. In an overwhelmingly split group, 36% of respondents say that political instability is the biggest risk; with half of these respondents citing President Donald Trump and the other half naming Congress and/or the possibility of a Democrat being elected president. Additionally, 7% of respondents name the Federal Reserve and interest rates as their biggest concerns, while 10% say consumer sentiment and media influence and 9% say valuations.
Here is a sampling of the responses:
- “Trade, Brexit and political unrest in the U.S. and Europe.”
- “Impeachment proceedings and Washington risk. Our political parties’ polarization is going to cause market friction that will weigh on less-than-stellar earnings reports.”
- “Stock valuations are too high, volatility is increasing and the trade wars only make it worse.”
- “Politics and trade. Everyone knows something, everything and nothing.”
- “The Fed now has limited tools for stimulating the economy away from a recession.”

Bullish: 33.6%, up 13.3 points
Neutral: 35.3%, down 0.4 points
Bearish: 31.1%, down 12.9 points
Bullish: 38.5%
Neutral: 31.0%
Bearish: 30.5%
October 10, 2019 Not Selling Can Have a Cost
October 3, 2019 Thoughts and Caveats About Brokers Ending Commissions
September 26, 2019 ETFs May Be Better Than Mutual Funds, But …
September 19, 2019 How I Incorporate Value Into My Strategy

Discussion
Tom Schaber from OH posted over 6 years ago:
Re Article on 60/40. A diligent 35 year old investor, investing $300 a month in S&P 500 for 30 years (up to retirement) would have $605K vs $462K if s/he had invested in your 60/40 split. Granted the volatility of the 100% would have been greater (Max drawdown 48% vs 27%) but that 27% "loss" to a conservative investor would have been just as scary as would have the 48% to the aggressive investor. And... it isn't a loss until you sell it. In the end, isn't the winner the one with the most money at retirement time?
Lillian Toll from CT posted over 6 years ago:
Interesting observation. What if this 35 yr. old was near retirement when the 2008 crash happened?
hugh from WA posted over 6 years ago:
I tend to track with Tom S. AAII has shown that stocks are best for the long view, assuming you stick with them during dips. Bonds would seem to be a way to capture profits during the end game with short view toward withdrawal.
You need to log in as a registered AAII user before commenting.
Create an account