

How I Incorporate Value Into My Strategy
by Charles Rotblut | September 19, 2019
Over time, I’ve evolved how I incorporate value into my investing strategy. For a long while, I used absolute limits on the price-to-book (P/B) and price-earnings (P/E) ratios. Then I switched to my current practice of using relative valuations incorporating the price-to-book, price-to-sales (P/S) and price-to-cash-flow (P/CF) ratios. This is the same strategy used for VMQ Stocks.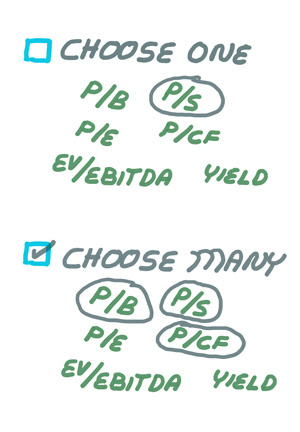
Before I explain why I think my newer method is better, I want to step back and discuss the bigger picture. Value investing—the concept of buying stocks at bargain prices—works if you are committed to and disciplined about using it. A good analogy is dieting. While there are arguments about how much protein you should consume relative to carbohydrates, dieting is essentially all about consuming fewer calories than you burn. Value is the same way; there are nuances to consider but it’s more important to simply avoid overpaying when buying a stock.
As far as the nuances are concerned, there are two to focus on. The first is what ratios you use. The second is choosing between absolute and relative valuations.
In terms of ratios, most will help you separate the cheap stocks from the expensive stocks. It doesn’t matter if you use book value, sales, cash flow, earnings or EBITDA (earnings before interest, taxes, depreciation and amortization) as your basis. With any of these measures, you’ll get higher returns by favoring stocks with lower valuations and eschewing those with higher valuations.
While you could pick one ratio, I think there is an advantage to combining them. Combining valuation ratios provides confirmation about a stock being cheap or expensive. Rather than relying on one single indicator, you’re getting several signals potentially flashing the same sign: the stock is cheap or it’s not. When the indicators give you differing signals, you can average them to get a consensus. If one ratio says the stock is cheap, another says the stock has fair valuation and a third says the stock is expensive, then the average of all three implies that the stock is fairly valued. This simple type of analysis can be very effective at helping you gauge a stock’s attractiveness.
An easy way to do this is to look at the relative valuations, an indicator that we, at AAII, provide and built into VMQ Stocks. A relative valuation compares a stock’s valuation to the valuations of all other stocks. It’s calculated by placing every stock into a percentile ranking, from lowest to highest. A stock with a price-to-sales ratio of 0.7 has a valuation ranking in the lowest 25%. A price-to-sales ratio of 1.9 ranks a stock at the 50th percentile, while a price-to-sales ratio of 4.2 puts a stock in the expensive 75th percentile. Relative valuations work well because you can simply calculate the average rank to determine if the stock has a below-average valuation or an above-average valuation. Plus, using relative valuations in a screen always ensures you’ll find investment candidates (assuming your other criteria are not too restrictive).
The alternative is to use absolute valuations such as a price-earnings ratio no higher than 10.0. The challenge with using this method is potentially not identifying enough qualifying stocks from which to build a diversified portfolio. During extended bull market periods when valuations rise, you’ll end up with fewer stocks to choose from. I used to use absolute valuations; I stopped doing so because I found relative valuations gave me more options from which to choose.
My strategy is the same one we use in VMQ Stocks. The VMQ strategy seeks out stocks whose combined price-to-book, price-to-sales and price-to-cash-flow ratio rankings are below average. This allows us to cast a wider net for investment candidates without overpaying for the stocks we do buy: a win-win situation.

-
“What Works”: Key New Findings on Stock Selection – James O’Shaughnessy explained how he combines value indicators in this October 2013 AAII Journal article.
-
Value Investing’s Differing Short- and Long-Term Performance Record – In this look at the performance record of value investing, I included an analysis of four different ratios.
Optimism among individual investors about the short-term direction of the stock market improved for the third consecutive week. The latest AAII Sentiment Survey also shows a modest increase in neutral sentiment and a drop in pessimism.
Bullish sentiment, expectations that stock prices will rise over the next six months, rose 2.2 percentage points to 35.3%. Even with the increase, optimism remains below its historical average of 38.0% for the 30th time this year and the 18th time in 19 weeks.
Neutral sentiment, expectations that stock prices will stay essentially unchanged over the next six months, increased 1.2 percentage points to 36.8%. Neutral sentiment is above its historical average of 31.5% for the 17th time in 18 weeks.
Bearish sentiment, expectations that stock prices will fall over the next six months, fell 3.4 percentage points to 27.8%. Pessimism is below its historical average of 30.5% for the first time in seven weeks.
The continued improvement in optimism and decrease in pessimism is occurring as volatility in stock markets has calmed down from last month. Bullish and neutral sentiment continue to be at their highest levels and bearish sentiment is at its lowest level since July 31, 2019. All three indicators are currently within their typical ranges.
Many individual investors have been monitoring trade negotiations, particularly between the U.S. and China. Additionally, many AAII members expect a recession to start within the next 12 to 24 months. Also having an influence on sentiment are Washington politics, geopolitics, valuations, corporate earnings, monetary policy and interest rates.
This week’s special question asked AAII members for their opinion about the overall level of sentiment currently being reflected by the market. We received a variety of responses. Almost one of four respondents (22%) believe current sentiment reflects uncertainty, indecisiveness or caution. About 14% think there is too much optimism being priced in. An additional 7% describe sentiment as being optimistic. Conversely, 11% think there is too much pessimism. A similar proportion of respondents think the current level of sentiment is reasonable or about right. About 9% say sentiment is being driven by headlines, politics, trade or the Federal Reserve.
Here is a sampling of the responses:
- “Too many people being too carefully invested due to angst. This means upward potential.”
- “Overall sentiment seems right.”
- “The market seems to be treading water while waiting for something big to happen.”
- “Too much reaction to the news media and not enough focus on the fundamentals.”
- “Too optimistic and not based on facts and data.”

Bullish: 35.3%, up 2.2 points
Neutral: 36.8%, up 1.2 points
Bearish: 27.8%, down 3.4 points
Bullish: 38.5%
Neutral: 31.0%
Bearish: 30.5%
September 12, 2019 This Year’s Volatility Has Been Normal
September 5, 2019 Stocks With Travel Perks for Shareholders
August 29, 2019 Stocks Look Cheap Relative to Bonds
August 22, 2019 Dollar-Cost Averaging Works Well for Retirement Contributions

Discussion
No comments have been added yet. Add your thoughts to the discussion!
You need to log in as a registered AAII user before commenting.
Create an account