

This Year’s Volatility Has Been Normal
by Charles Rotblut | September 12, 2019
This week’s relative calm in the markets is likely a welcome change. It follows an approximate six-week period where the S&P 500 index swung in a 186-point range. The point range equates to an approximate 6% move in both directions.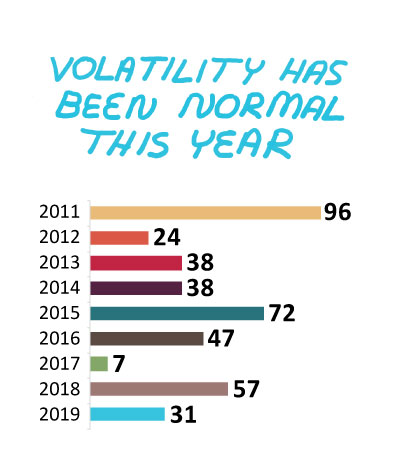
More telling are the day-to-day moves in the large-cap index. The S&P 500 closed either up or down by at least 1% during 13 out of the 26 trading days ending last Friday. To put this into perspective, there were only 19 days when the S&P 500 closed up or down by more than 1% for the entire period of January 1, 2019, through July 29, 2019.
If it felt like the market was even more volatile, it’s likely because you’re paying attention to intraday moves and focusing on point changes instead of percentage changes. There was a 12-consecutive-day streak in August when the S&P 500 moved by more than 1% on an intraday basis. These percentile moves equate to larger absolute point moves with major indexes at current levels relative to what we’ve seen in the past.
The media has yet to catch up to this fact. A one-percent change in the Dow Jones industrial average equates to a point change of more than 250 points. Yet, anytime the blue-chip average moves by 100 points or 200 points, headlines pop up about the change. A 200-point move in the Dow is no longer significant. Even a 400-point move would signify nothing more than a modest increase in intraday volatility. Headlines such as “Dow Tumbles” or “Stocks Soar” should be saved for much bigger point moves.
So far this year, the level of volatility—as measured on a closing day basis—hasn’t been worthy of using superlatives in headlines on most days. The S&P 500’s level of volatility is on pace to be about average with what we’ve seen since 2011 (40.4 days). Last year had 57 trading days when the S&P 500 gained or lost more than 1%; 2015 had 72 such days. At the other end of the spectrum, 2017 was unusually calm with just seven such days. Year to date, there have been 31 days with a gain or decline greater than 1% in 2019. Volatility can come in bouts, so this year could well end up being more or less volatile than average.
You know well two of the culprits responsible for last month’s price swings: trade and recession fears. China and the U.S. remained caught up in an on-and-off relationship (one day they’re talking and seemingly not the next), while the events in England would make a good script for the British version of “House of Cards.” Somewhere, writers of political dramas are probably saying to themselves, “Why didn’t I think of this?”
A third culprit is liquidity. The Wall Street Journal noted last week that trading activity has been weak across a variety of markets, including stocks, bonds, currencies and derivatives. When there are fewer buyers and sellers overall, an imbalance on either side can lead to bigger price swings. It’s typically not unusual to see lighter trading volumes in August.
Equity investors who didn’t react to last month’s swings or headlines haven’t experienced much overall change, beyond stock-specific movement (e.g., a reaction to earnings news). Various market indexes—both market-cap and equal-weighted—are roughly now at where they were three months ago. Despite all the chatter and headlines, the volatility didn’t take much of a bite out of diversified stock portfolios.
Of course, the big question is what happens next? As I find myself responding more and more often these days: If you can tell me what is going to happen with trade, I can give you a better answer. Uncertainty over trade is having an impact on the economy as well as the market.
While it’s easy to focus on what’s making headlines at the moment, the short-term moves in the stock market shouldn’t affect your portfolio decisions. Diversify your portfolio according to your cash needs—short-term horizons require conservative allocations (money markets, short-term bonds, etc.); long-term horizons require aggressive allocations (equities)—and you shouldn’t have to worry about what the market does on a given day.
You can, of course, use any bump in volatility to your advantage. If you are doing Roth IRA conversions, pick down days to transfer equities from your traditional IRA or 401(k) to the account. You’ll be able to move more shares over for the same tax liability. Volatility can also create opportunities to buy stocks you like when they are on sale and sell stocks otherwise violating your sell rules when market fluctuations push prices upward.
Most importantly, develop the habit of looking at the stock market—and especially your portfolio’s balance—less often. The markets will seem less volatile and you’ll be more disciplined.

-
Data Mixed on Whether Volatility Is Rising – When volatility is looked at on a monthly—instead of on a daily—basis, there is no clear evidence that it has risen over the past 80 years.
-
Creating and Following a Real Financial Plan – One of the ways you can avoid being swayed by the market’s volatility is to have a clear sense of what your financial goals truly are.
Optimism among individual investors about the short-term outlook for stocks continues to rebound as pessimism plunged. The latest AAII Sentiment Survey also shows higher neutral sentiment.
Bullish sentiment, expectations that stock prices will rise over the next six months, rose 4.5 percentage points to 33.1%. Even with the increase, optimism remains below its historical average of 38.0% for the 29th time this year and the 17th time in 18 weeks.
Neutral sentiment, expectations that stock prices will stay essentially unchanged over the next six months, rose 3.8 percentage points to 35.6%. The increase keeps neutral sentiment above its historical average of 31.5% for the 16th time in 17 weeks.
Bearish sentiment, expectations that stock prices will fall over the next six months, plunged 8.3 percentage points to 31.3%. The historical average is 30.5%.
The change in sentiment is occurring as volatility in stock markets has calmed down. Bullish and neutral sentiment are at their highest levels and bearish sentiment is at its lowest level since July 31, 2019. All three indicators are within their typical ranges.
Many individual investors have been monitoring trade negotiations, particularly between the U.S. and China. Additionally, many AAII members expect a recession to start within the next 12 to 24 months. Also having an influence on sentiment are Washington politics, geopolitics, valuations, corporate earnings, monetary policy and interest rates.
This week’s special question asked AAII members what their comfort level is with the current valuations of stocks and why. More than 50% of respondents describe themselves as uncomfortable with current valuations and believe that many stocks are overvalued. On the other hand, 38% of respondents say that they are somewhat comfortable to very comfortable with current stock valuations because the economy is performing well. Finally, 12% say that they are not sure of their comfort level because of ongoing turmoil, such as the trade war and the uncertainty of a resolution occurring in the near future.
Here is a sampling of the responses:
- “Many stocks are overpriced; most are fairly priced. It’s hard to find a stock that’s been overlooked by the market and therefore provide for a great investing opportunity.”
- “Current valuations are at the higher end of the price-earnings (P/E) ratio, but they are justified by a fairly healthy economy.”
- “In general, I’m cautious but comfortable. Of course, I feel some assets are overpriced and some are underpriced. But that is always the case.”
- “My comfort level with the current stock valuations is fairly low. However, I believe stocks will become more overvalued during the next six months.”
- “The current valuation is high and probably not sustainable, so I am standing pat on purchases and waiting to see where the market goes from here.”

Bullish: 33.1%, up 4.5 points
Neutral: 35.6%, up 3.8 points
Bearish: 31.3%, down 8.3 points
Bullish: 38.5%
Neutral: 31.0%
Bearish: 30.5%
September 5, 2019 Stocks With Travel Perks for Shareholders
August 29, 2019 Stocks Look Cheap Relative to Bonds
August 22, 2019 Dollar-Cost Averaging Works Well for Retirement Contributions
August 15, 2019 To Be Different Than an Index Fund, Diversify by Strategy

Discussion
Donald Ecck from NY posted over 7 years ago:
Nothing ticks me off more than to click on a link and be taken to something I wasn't looking for. So how about fixing a problem. Here's the scenario: I don't always get a chance to read all my email every week, much less every day. So when I click on a link in an email from AAII Update expecting to get an update labeled August 29 and get the one for September 12, I feel cheated. Apparently you don't archive the update articles link you do almost every else. Why Not? Are they not useful a week or two later? If not, why publish them at all? If they are, and I believe they are both useful and interesting and, isn't this what you're all about, educational. So how about archiving these fascinating and informative short notes that one of your primary spokesmen took the time to write and share...if only for a brief time to a few people who are obsessed with reading every email as soon as it comes out.
Chris from Texas posted over 7 years ago:
I agree (though not as ticked off). I also went to read a previous weeks article and unable to find.
Richard from IN posted over 7 years ago:
Right above this Discussion thread there are links to the 4 most recent prior weekly Updates as well as a "Previous Articles" button that will link to a page with even more older Update articles.
You need to log in as a registered AAII user before commenting.
Create an account