

Thoughts and Caveats About Brokers Ending Commissions
by Charles Rotblut | October 03, 2019
Every so often, investors get to channel their inner Homer Simpson and shout “Woo Hoo!” This week is one of those times, at least from the standpoint of commissions. I’ll share my observations and thoughts about the broker price war as well as point out a few caveats.
The latest price war started last week when Interactive Brokers Group Inc. (IBKR) unveiled a new offering: IBRK Lite. This service provides “commission-free, unlimited trades on U.S. exchange-listed stocks and exchange-traded funds.” Interactive Brokers’ announcement didn’t attract much attention.
What did turn heads was this Tuesday’s announcement from Charles Schwab Corp. (SCHW). The discount broker said it would eliminate “commissions for stocks, ETFs and options listed on U.S. or Canadian exchanges” starting on Monday, October 7, 2019. Several hours later, TD Ameritrade Holding Corp. (AMTD) followed suit by saying it would eliminate commissions on “exchange-listed stock, ETF (domestic and Canadian), and option trades” effective October 3 (today). Yesterday, E*Trade Financial Corp. (ETFC) joined the fray and will “eliminate retail commissions for online U.S.-listed stock, ETF, and options trades” as of October 7, 2019.
It’s not clear what prompted the moves. Charles Schwab cited the recently published memoir by its founder, but it seems likely there were other business considerations at play—particularly market share. Robinhood, an app offering commission-free trading, could have been seen as a big enough threat to spur action. Furthermore, treating stock and ETF trades as a loss leader makes sense if clients can be upsold to other services, such as advisory and banking. Schwab realizes just 5% of its net revenues from trading commissions. In contrast, commissions account for 34% of TD Ameritrade’s, 17% of E*Trade’s and 36% of Interactive Brokers’ year-to-date net revenues.
We’re still waiting to see what Fidelity will do and whether Vanguard will also act. Both have large fund businesses and offer advisory services, though Fidelity has local offices nationwide and provides broader banking services. Prior to this week, Vanguard was already waiving commissions on nearly 1,800 ETFs—about three-quarters of all ETFs—and was charging little to no commissions for clients with account balances of $500,000 or more. Between Vanguard and Fidelity, my guess is that Fidelity will feel the most pressure to act. Fidelity is privately held while Vanguard is owned by its shareholders, so we don’t know how dependent either is on brokerage commissions.
As far as what the $0 commissions mean to you, the savings on commissions will obviously put more money in your pocket. Investors with smaller account balances or investors making paycheck-related contributions to IRAs and Roth IRAs will see the biggest impact. A person making bi-weekly contributions to an IRA of, say, $250 (equivalent to the maximum annual contribution of $6,000 for those not eligible for the additional $1,000 catch-up contribution) will now have a much wider array of ETFs to choose from as well as the ability to dollar cost average into individual stocks. For investors with far larger amounts to invest, the savings will be minor but will still accumulate over time.
If you bought a stock this week or, say, last week, the commissions you paid likely won’t be refunded. If you recently bought a no-commission ETF on either E*Trade’s or TD Ameritrade’s platform, the 30-day short-term redemption fee may still apply. I’m personally in this situation, having bought ETFs for my and my wife’s IRAs from TD Ameritrade’s no-commission list on Monday. The customer service rep I spoke with this morning said the short-term trading restriction still applied. I’ve placed calls to both firms’ media departments to confirm this but neither has called back.
Even once all of the $0 commissions go into effect, transaction expenses won’t be zero since there are other costs that will remain. Sells made in a taxable account will be subject to capital gains taxes if a profit is made. The small U.S. Securities and Exchange Commission (SEC) or processing fee you may have seen on your trade confirmations will remain as well. These are charges levied by the exchanges to offset a transaction fee they must pay to the SEC based on the volume of securities sold. (While they can be labeled an “SEC fee,” they are an exchange—and not an SEC—fee.) You will also continue to incur differences between the bid (the price buyers are willing to pay) and the spread (the price sellers are demanding). If a stock has lower levels of volume, you could end up moving the price with your order, which would be another cost.
The biggest cost you could incur is behavioral in nature. Acting on emotion, being overconfident, jumping to a quick decision, focusing on short-term events instead of long-term goals and not having a defined, disciplined process can all have large, long-term costs. The forfeiture of wealth from behavioral errors can far exceed the amount saved from not having to pay commissions. This risk is the biggest reason why $0 commissions are not a reason to trade more frequently.

-
Comparing the Most Popular Online Brokers – With commissions going to $0, brokers will have to compete on their services. We published a comparison of the major discount brokers earlier this year.
-
Stock Order Types – Even at $0 commissions, you should give thought to the type of order you place. This article provides a primer on the various options.
Optimism among individual investors about the short-term direction of the stock market is at a 10-month low. The latest AAII Sentiment Survey also shows higher levels of neutral and bearish sentiment.
Bullish sentiment, expectations that stock prices will rise over the next six months, plunged 8.0 percentage points to 21.4%. Optimism was last lower on December 12, 2018 (20.9%). Bullish sentiment is below its historical average of 38.0% for the 32nd time this year and the 20th time in 21 weeks.
Neutral sentiment, expectations that stock prices will stay essentially unchanged over the next six months, rose 1.8 percentage points to 39.2%. Neutral sentiment was last at this level on May 22, 2019. This was the fifth consecutive weekly increase. The rise keeps neutral sentiment above its historical average of 31.5% for the 19th time in 20 weeks.
Bearish sentiment, expectations that stock prices will fall over the next six months, jumped by 6.2 percentage points to 39.4%. Pessimism remains above its historical average of 30.5% for the ninth time in 11 weeks.
Bullish sentiment is back at an unusually low level for the first time in five weeks. Historically, such readings have been followed by higher-than-average and higher-than-median six- and 12-month S&P 500 index returns. Both neutral and bearish sentiment are within but near the upper end of their respective typical ranges.
This week’s drop in bullish sentiment follows the return of downside volatility to the stock market and weaker-than-expected economic reports.
Many individual investors have been monitoring trade negotiations, particularly between the U.S. and China. Also having an influence on sentiment are Washington politics, geopolitics, valuations, corporate earnings, monetary policy and interest rates.
This week’s special question asked AAII members how they expect the U.S. economy will perform over the next six to 12 months. Approximately 46% of responses we received say they believe the U.S. economy will weaken over the next six to 12 months. Many respondents cite trade issues for the expected downturn, while others expect political turmoil to negatively impact the economy. On the other hand, 31% of respondents say that they expect the economy to perform moderately well, with expected growth to remain positive but not as high as in previous years. Additionally, 23% say that they believe the U.S. economy will remain flat over the next six to 12 months as the Federal Reserve continues to adjust monetary policy.
Here is a sampling of the responses:
- “Poorly. As tariffs affect China, the world economy will suffer greatly. Our economy is part of the world and is already showing many signs of distress.”
- “It will trend downward due to all the trade disputes and reduced economic activities.”
- “Growth and inflation as measured by the government will both slow but no recession ... yet.”
- “I suspect the economy to continue to grow at a 2.0% to 2.5% pace. Solid, but not fast, and not even close to the best economic growth that we have had in the past.”
- “I believe the economy will hold steady as interest rates decline.”

Bullish: 21.4%, down 8.0 points
Neutral: 39.2%, up 1.8 points
Bearish: 39.4%, up 6.2 points
Bullish: 38.5%
Neutral: 31.0%
Bearish: 30.5%
AAII Asset Allocation Survey
Individual investors’ exposure to cash fell to a 20-month low in September. The latest AAII Asset Allocation Survey also shows an increase in equity exposure and a modest decline in exposure to fixed-income investments.
Stock and stock fund allocations rebounded by 2.2 percentage points to 66.5%. Equity allocations are above their historical average of 61.0% for the 78th consecutive month.
Bond and bond fund allocations pulled back by 0.5 percentage points to 18.9%. Fixed-income allocations are above their historical average of 16.0% for the seventh consecutive month and the eighth time in nine months.
Cash allocations fell 1.7 percentage points to 14.6%. This is the smallest exposure to cash since January 2018 (13.3%). The drop also keeps cash allocations below their historical average of 23.0% for the 94th consecutive month.
Though the yield on the benchmark 10-year Treasury note rebounded last month, certificate of deposit (CD) and money market account interest rates continued to decline. As far as stocks, optimism in our weekly sentiment survey improved compared to August but continued to remain below average.
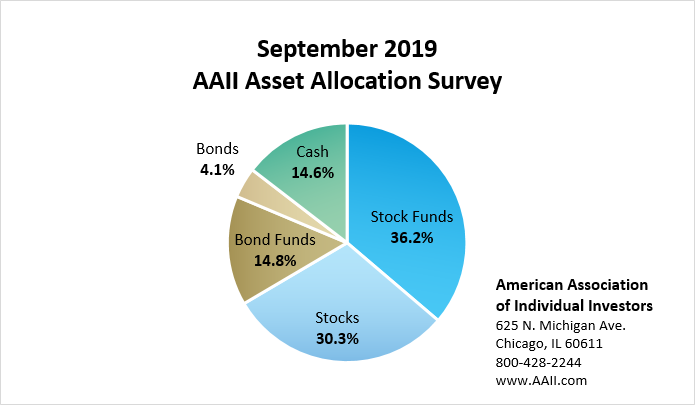
September AAII Asset Allocation Survey results:
- Stocks and stock funds: 66.5%, up 2.2 percentage points
- Bonds and bond funds: 18.9%, down 0.5 percentage points
- Cash: 14.6%, down 1.7 percentage points
September AAII Asset Allocation Survey details:
- Stocks: 30.3%, up 4.3 percentage points
- Stock Funds: 36.2%, down 2.0 percentage points
- Bonds: 4.1%, up 0.1 percentage points
- Bond Funds: 14.8%, down 0.6 percentage points
Historical Averages:
- Stocks/Stock Funds: 61.0%
- Bonds/Bond Funds: 16.0%
- Cash: 23.0%
The numbers are rounded and may not add up to 100%.
The AAII Asset Allocation Survey has been conducted monthly since November 1987 and asks AAII members what percentage of their portfolios are allocated to stocks, stock funds, bonds, bond funds and cash. The survey and its results are available online at: www.aaii.com/investor-surveys.
Want to weigh in? Take the survey yourself and see results online at www.aaii.com/assetallocationsurvey.
- Stocks and Stock Funds: 66.5%, up 2.3 percentage points
- Bonds and Bond Funds: 18.9%, down 0.5 percentage points
- Cash: 14.6%, down 1.8 percentage points
- Stocks: 30.3%, up 4.3 percentage points
- Stocks Funds: 36.2%, down 2.0 percentage points
- Bonds: 4.1%, up 0.1 percentage points
- Bond Funds: 14.8%, down 0.6 percentage points
- Stocks/Stock Funds: 62.0%
- Bonds/Bond Funds: 16.0%
- Cash: 22.0%
Take the Asset Allocation Survey.
September 26, 2019 ETFs May Be Better Than Mutual Funds, But …
September 19, 2019 How I Incorporate Value Into My Strategy
September 12, 2019 This Year’s Volatility Has Been Normal
September 5, 2019 Stocks With Travel Perks for Shareholders

Discussion
Barry Estell from CA posted over 7 years ago:
If you have money in a money market fund, they are making it all back. Charging 50 basis points to manage a government MMF is tantamount to stealing, but I see no escape.
You need to log in as a registered AAII user before commenting.
Create an account