

The Yield Curve Is Getting Flatter
by Charles Rotblut | May 17, 2018
The stock market endured a mini tantrum on Tuesday in response to a rise in bond yields. The Wall Street Journal described the 10-year Treasury note’s yield as experiencing its largest one-day increase since March 2017. The rise was big enough to cause the benchmark note to end the day with its highest yield in nearly seven years. Even before rising further yesterday and today, the yield hit a level not seen since the summer of 2011.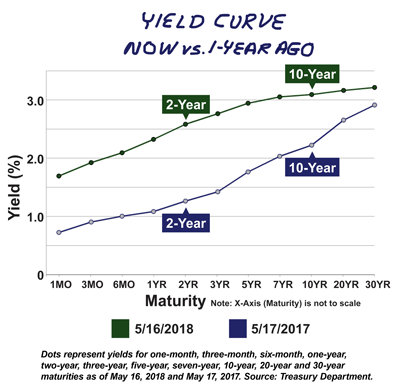
In addition to daily moves in the 10-year Treasury note, many financial market observers are eyeing the yield curve. The yield curve is a plot of the yields for Treasury securities of varying maturity. Under completely normal conditions, the yield curve would be rising upward with lower yields for shorter-term securities and higher yields for longer-term securities. This makes sense because the longer an investor has to wait to get their money back, the more compensation they are going to demand. Inflation isn’t much of a risk over 90 days, but it is a risk over periods of, say, five, 10 or 30 years.
Typically, this is how bond market participants think. They’re comfortable with getting lower interest rates on bills and notes with shorter periods to maturity and demand higher interest rates on bonds with longer periods to maturity. Occasionally, sentiment changes and the bond curve either flattens or inverts. When there is even a perception of this phenomenon occurring, heads turn.
Since the mid-1970s, every economic recession in the U.S. was preceded by an inverted yield curve, an observation made by Michael W. Klein on the EconoFact website. Specifically, recessions followed periods when the 10-year Treasury note’s yield fell below that of the two-year note’s yield. In such scenarios, you could get a higher interest rate for locking your money up for just two years as opposed to 10 years.
Such a situation could occur if traders expected inflation to weaken in the future. Less economic growth or an outright recession would alleviate upward pressure on prices and potentially increase the risk of deflation. The actions of the Federal Reserve can also have an effect, as Klein notes. If the Federal Reserve raises short-term rates, yields could rise more on the short-end of the curve than they do on the long-end of the curve. This would happen if traders expect the Fed’s actions to be temporary or very gradual in scope, the latter of which has so far currently been the case.
Presently, the difference between the two-year note and the 10-year note has narrowed. This is apparent on the chart above, which provides a year-over-year comparison. Twelve months ago, you could get nearly a full percentage point (100 basis points) more in yield by buying a 10-year note instead of a two-year note (1.26% for the two-year note versus 2.22% for the 10-year note). As of yesterday, the differential has been cut almost in half (2.58% versus 3.09%). Notice how much more the yield on the two-year note has increased, 132 basis points, relative to the 10-year note, whose yield has risen by 87 basis points.
Not specifically highlighted on the chart, but still visible, is the flattening at the long-end of the curve. It’s most apparent when looking at the five-year note in comparison to the 30-year bond. (The five-year note is two dots to the right of the two-year note; the 30-year bond is the last dot on the right side.) Twelve months ago, the yield difference between the two securities was 115 basis points (1.76% versus 2.91%). As of yesterday, the differential narrowed to 27 basis points (2.94% versus 3.21%). You can see other comparisons on the Treasury Department’s website. (Note: The website requires a Flash-enabled browser.)
It’s too early to worry about the next recession occurring. Even a casual observer can surmise that the Federal Reserve’s actions are having an impact on the bond market. Corporate revenues and earnings were strong during the first quarter. The new tax law is boosting corporate profits and giving many taxpayers extra cash. Plus, as Klein points out, there is no consistent pattern of how quickly the start of a recession follows the inversion of the yield curve. Rather, for the recessions that preceded the 2008 financial crisis, the length of time between the inversion and the start of the recession has varied between 10 and 18 months.
The curve shows that the rewards for going out to the very long end of the curve aren’t high enough to justify the term risk. You are not getting enough extra yield to compensate you for the extra time. At the short end, the curve is telling you to go shopping for interest rates if you are a saver. Significantly higher rates on savings accounts and certificates of deposits (CDs) can be attainable if you’re willing to bank online. For instance, Discover—with whom AAII has an affinity program that I personally use—is currently offering AAII members 1.60% interest on their savings accounts.

- How to Make Money From Bonds – Strategies for constructing a bond ladder when the yield curve is ascending, flat or inverted.
- Telling Curves: What Bond Yields Reveal About the Markets – In this 2003 AAII Journal article, my colleague Wayne Thorp explained the yield curve in greater detail.
The percentage of individual investors expressing pessimism about their short-term outlook for stocks is at its second-lowest level of the year, according to the latest AAII Sentiment Survey. At the same time, the percentage of individual investors describing their outlook as “neutral” is above 40% for a third consecutive week.
Bullish sentiment, expectations that stock prices will rise over the next six months, rebounded for a second consecutive week and rose 3.2 percentage points to 36.7%. Optimism remains below its historical average of 38.5% for the 12th consecutive week and the 13th time in 15 weeks.
Neutral sentiment, expectations that stock prices will stay essentially unchanged over the next six months, rose 1.8 percentage points to 42.7%. Neutral sentiment was last higher on March 7, 2018 (45.2%). This is the 13th consecutive week with a neutral sentiment reading above the historical average of 31.0%.
Bearish sentiment, expectations that stock prices will fall over the next six months, fell 5.0 percentage points to 20.6%. Pessimism was last lower on January 3, 2018 (15.6%). The drop keeps bearish sentiment below its historical average of 30.5% for the fifth consecutive week and the 19th time out of the past 23 weeks.
At its current level, bearish sentiment is at an unusually low level, though just barely so. The breakpoint is 20.7%. Historically, below-average levels of pessimism have been followed by below-average and below-median returns for the S&P 500 index over the following six- and 12-month periods.
Neutral sentiment is above 40% on three consecutive weeks for the first time since June 29, 2017, through July 13, 2017. Historically, unusually high readings for neutral sentiment have been followed by slightly higher than average six-month returns for the S&P 500, but not significantly so.
Many individual investors, but not all, anticipate continued volatility and/or think that the current political backdrop could have a further impact on the stock market. Trade policy is influencing some individual investors’ sentiment. While many individual investors either approve of the Federal Reserve’s plan to gradually raise interest rates or don’t expect it to affect the stock market, some are concerned about the impact that rising rates will have. Also influencing sentiment are valuations, tax cuts, earnings and economic growth.
This week’s special question asked AAII members for their opinion of the current pace of economic growth. Approximately 39% have a positive view of the economy and/or expected growth, while a little over 38% have a more pessimistic view.
Those who have a positive view are pointing toward the tax cuts, change in regulations, earnings, economic indicators and a sense of optimism. Those who are negative or cautious are fretting about growth having peaked, higher interest rates, trade issues, stagnant wages and both fiscal and consumer debt.
Here is a sampling of the responses:
- “Good for the moment. Tax reform is kicking in.”
- “Things look good. The Fed is raising rates slowly and cautiously and the market can handle these changes. Earnings are very favorable.”
- “Economic growth is positive, but it can be slowed by the rise in oil prices and trade negotiations.”
- “Everyone is becoming more cautious and not willing to bet on the future.”
- “Too early to tell the impact of the Trump tax cuts and the potential trade war.”
- “Fueled by borrowing, so susceptible to disappearing.”

Bullish: 36.7%, up 3.2 points
Neutral: 42.7%, up 1.8 points
Bearish: 20.6%, down 5.0 points
Bullish: 38.5%
Neutral: 31.0%
Bearish: 30.5%
May 10, 2018 Midterm Elections and the Worst Six Months
May 3, 2018 Coming Out Ahead by Doing Less
April 26, 2018 A Checklist Can Make You a Better Investor
April 19, 2018 Guidelines for Projecting Retirement Savings

Discussion
No comments have been added yet. Add your thoughts to the discussion!
You need to log in as a registered AAII user before commenting.
Create an account