Related

Portfolio Strategies
Following long-term portfolio strategies can feel at times like watching paint dry, until something happens. Last year was one of those years. Volatility jumped, and because it dragged down equity prices the potential need to actively rebalance our portfolios was negated. Last year also showed the beneficial role rebalancing can play in helping an investor emotionally stick with a portfolio heavily weighted in growth assets.
Before going into detail, here are a few takeaways:
Before explaining each of the bullet points further, I want to provide some background and updates about the models used for this analysis. Many of you who have been following these annual updates will notice a small change. Those of you who are new to them will have a better understanding of what’s being discussed by reading this brief section.
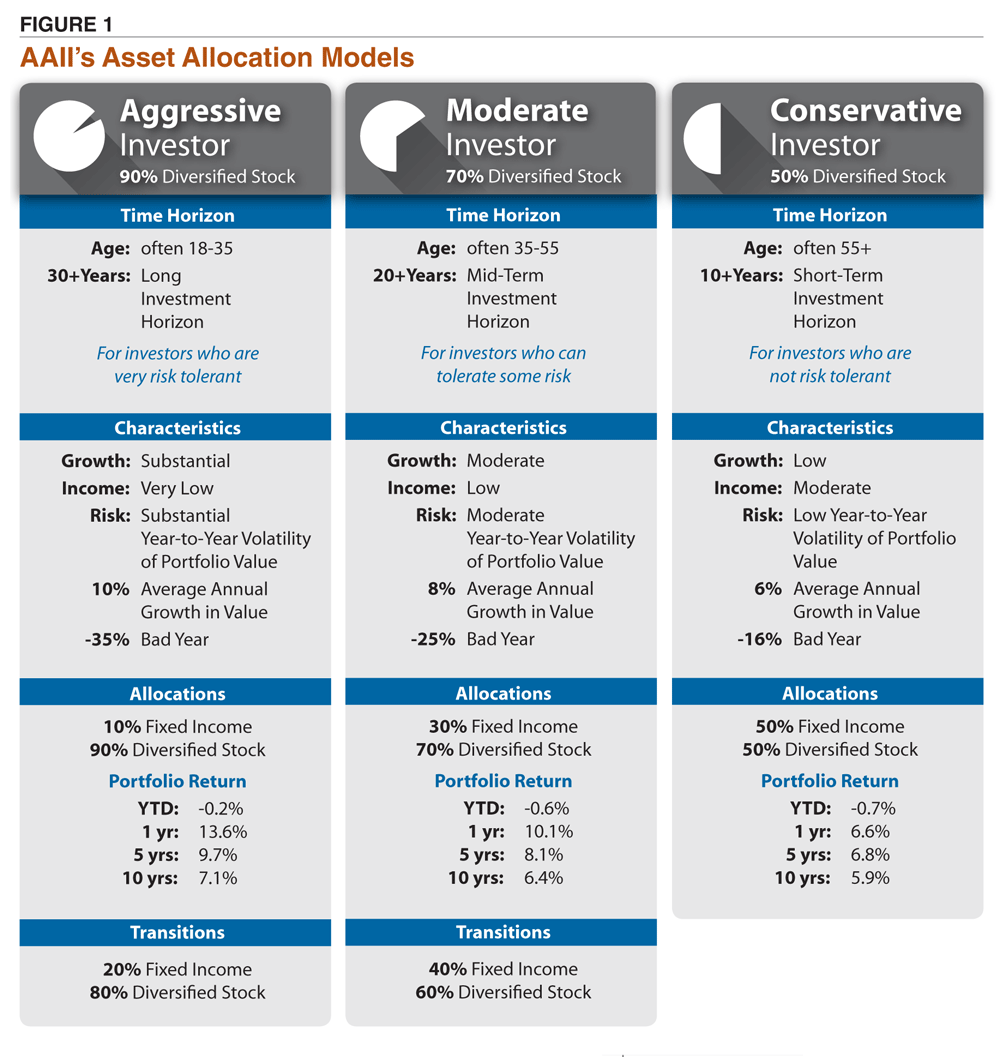
Since 2011, I’ve been conducting an ongoing analysis of hypothetical portfolios based on AAII’s moderate asset allocation model. This model calls for allocating 70% to a diversified collection of stocks and 30% to bonds. For the stock portion, the target allocation I’ve used is 20% in large-cap stocks, 20% in mid-cap stocks, 10% in small-cap stocks and 20% in international developed country and emerging market stocks. See Figure 1 for an illustration of the investor characteristics for the moderate allocation model, as well as the characteristics for two other AAII asset allocation models—aggressive and conservative.
The hypothetical portfolios are either non-withdrawal or withdrawal. No withdrawals are taken out of the first one (the “non-withdrawal” portfolio). The second, the “withdrawal” portfolio, assumes a retiree makes annual withdrawals based on an inflation-adjusted 4.5% amount. (The withdrawal rate is discussed in more detail later in this article.)
The allocation for the non-rebalanced portfolios was established at the beginning of the study. No additional changes are made to the portfolios. Rather, their allocations evolve based on the weighted performance of each fund held. The rebalanced portfolios are periodically adjusted back to their targeted allocations whenever the weighting of any single fund is more than five percentage points above or below its target. The 5% band is based on a Vanguard study (“Best Practices for Portfolio Rebalancing,” May 2011 AAII Journal).
The hypothetical portfolios use Vanguard funds to replicate the returns an investor could have realized after fund fees are factored in. The Investor Shares class of funds was used for the period of 1988 through 2017. The Admiral Shares class of funds was substituted in 2018 because Vanguard is no longer offering the Investor Shares class to most investors. Part of the goal of this study is to show the returns an investor could have realized in a real-world portfolio, gross of taxes and specific account fees (such as those charged by a workplace retirement plan).
A start date of 1988 was used because it was the first full year that return data was available for some of the funds used in the models. The models are updated annually using end-of-year return data. Spreadsheets with the full data and a thorough explanation of the calculations are linked in the online version of this article.
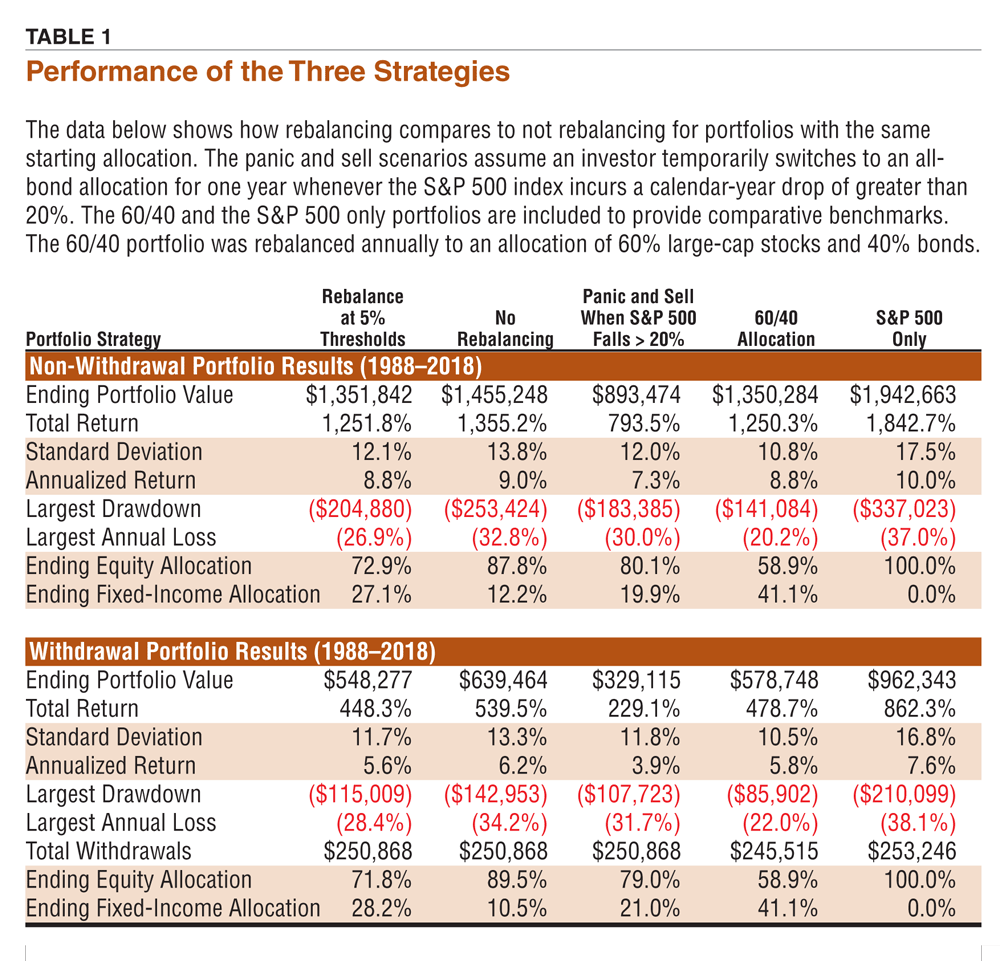
Two types of portfolios are presented in Table 1 to account for different life-cycle stages readers may be in. Non-withdrawal portfolios have no outflows. The hypothetical portfolios are treated as being fully funded at their inception dates with the dollars invested allowed to grow over time.
Withdrawal portfolios are akin to those held by a person in retirement who is taking withdrawals to fund living expenses. A 4.5% inflation-adjusted withdrawal rate is used. This is the withdrawal rate suggested by retired financial planner William Bengen. Bengen created the widely followed 4% withdrawal rule. He later determined a higher rate of 4.5% could be used with a diversified portfolio.
To provide some context on the difference, a 4.5% inflation-adjusted withdrawal rate used with a starting value of $100,000 would have provided a retiree with cumulative income of $250,868 over a 31-year period. A 4% withdrawal rate would have provided $222,994 of income over the same period with the same starting balance.
The difference in cumulative withdrawals does not equal the difference in ending wealth because of the frequency with which the withdrawals were taken. Every time a withdrawal is taken, there is less money in the portfolio to benefit from positive investment returns (or be hurt by negative returns). The annual withdrawals have the effect of gradually reducing how much money is left in the portfolio to grow. At the same time, the 4.5% withdrawal rate leads to increasingly larger dollar amounts being distributed than the 4% withdrawal rate because the starting value is larger. Every inflation adjustment is based on a starting value of $5,181 for the 4.5% withdrawal portfolio and a starting value of $4,605 for the 4% portfolio. (Each portfolio started with $100,000 that appreciated to $115,129 at the end of its first year in 1988.)
Last year was tough for investors to endure but did provide good testing grounds to see how portfolio models hold up. The timing of the correction in the S&P 500 index (a drop of 10% to 19%) and a bear market in other indexes (a drop of 20% or more) allowed us to see how each portfolio’s allocation changed during the downturn. The U.S. stock market bottomed in late December 2018 and year-end data is used for this analysis.
The most pronounced impact occurred in the non-withdrawal non-rebalanced portfolio. This portfolio ended 2017 with an equity allocation of 88.7%, well above the starting allocation of 70% in 1988. The high exposure left the portfolio vulnerable to a downturn in stock prices, which is what happened in 2018. The non-withdrawal non-rebalanced portfolio fell by 8.8% last year, its biggest loss since the 2008 plunge of 32.8%. The only other year with a bigger percentage loss than 2018 was 2002 when the portfolio tumbled by 12.9%.
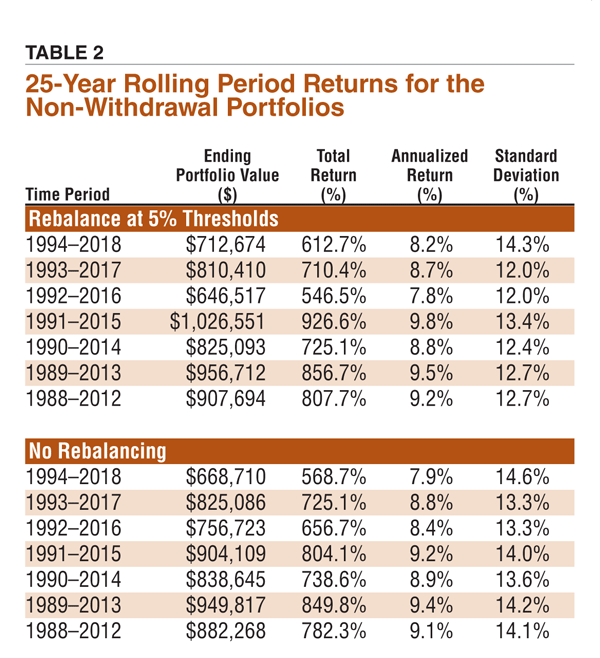
Not rebalancing has led to higher returns over the 31-year period studied, albeit at the cost of greater volatility. Relative to the rebalanced non-withdrawal portfolio, the non-rebalanced non-withdrawal portfolio is 12.6% more volatile even though both started with the same allocation. The return advantage is 0.2 points on annualized basis (9.0% versus 8.8%). While this is small on a percentage-point basis, it has led to an approximate $100,000 in increased wealth. As can be seen in the rolling-period analysis shown in Tables 2 and 3, the actual difference depends on the time period measured.
The rebalanced portfolio also incurred a loss in 2018, declining by 6.8%. The smaller loss shows the benefit of rebalancing—it cushioned the blow of last year’s volatility. Rebalancing is not intended to avoid losses; rather, it is intended to keep a portfolio from straying too far from its intended allocation. Since allocations drift toward the best-performing asset(s) over time, rebalancing reduces volatility by preventing the portfolio from having too much exposure to the riskiest assets. This level of risk control may be the difference between being able to stick with a long-term allocation or giving into emotions and selling at the wrong moment.
One concern about rebalancing is turnover. Rebalancing will require periodic transactions. The frequency depends on how often the portfolio is reviewed and how its assets perform relative to one another. Neither the non-withdrawal nor the withdrawal rebalanced portfolios required changes at the end of 2018. This was because Mr. Market took care of the necessary adjustments.
In the non-withdrawal rebalanced portfolio, the equity allocation pulled back from 74.7% in 2017 to 72.9% in 2018 because bonds fared comparatively better than stocks. The downside movement in stock prices allowed the bond allocation to rise from 25.3% in 2017—which was very close to the bottom of the lower five-percentage-point band allowed—to 27.1% at the end of 2018. The target allocation for bonds is 30%. Rebalancing annually is an option, but our analysis shows it leading to lower returns than a periodic approach. It would also lead to more frequent gains in a taxable account. (Periodic rebalancing would have fewer taxable events, but the dollar amounts would potentially be larger.) During the 31-year history, the non-withdrawal portfolio has been rebalanced nine times, an average of once every 3.4 years. The last rebalancing was needed at the end of 2013.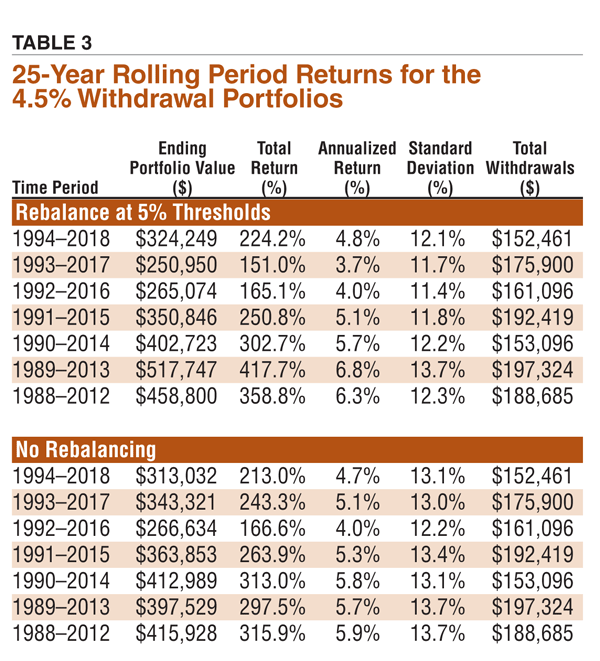
The equity allocation for the withdrawal rebalanced portfolio pulled back from 73.9% at the end of 2017 to 71.8% at the end of 2018. It has been rebalanced eight times, or once every 3.9 years. As was the case for the non-withdrawal rebalanced portfolio, relatively weaker returns in mid-cap, small-cap and international stocks helped to reduce the exposure to equities and increase exposure to bonds.
Note the use of the word “relative.” Portfolio weightings are determined by how each holding performs relative to all other holdings. A particular investment can increase in terms of allocation by falling less in value than other assets.
As stated, the non-withdrawal rebalanced portfolio incurred a smaller loss than its non-rebalanced counterpart in 2018, declining 6.8% instead of 8.8%. The performance difference was smaller for the withdrawal portfolios, though the withdrawal rebalanced portfolio did fare slightly better than its counterpart. In both cases, the outperformance was attributable to the comparatively higher allocation to bonds.
Further evidence of the role diversification can have is the 60/40 portfolio, which rebalances annually back to an allocation of 60% large-cap stocks and 40% bonds. On a non-withdrawal basis, this portfolio lost just 2.7%. Again, a higher allocation to bonds cushioned the blow of the drop in stock prices.
The 60/40 portfolio also held up better because its equity portion solely comprises large-cap stocks. Vanguard’s mid-cap, small-cap and international mutual funds all underperformed its S&P 500 index fund. Favoritism toward large-cap stocks made portfolios holding more of the Vanguard 500 Index fund (VFIAX) relative to the other stock funds appear better. Even the non-withdrawal S&P 500 only portfolio held up better last year than the portfolios following our moderate allocation models, falling by just 5.5%.
None of this should be interpreted as a condemnation of diversification. The returns are a snapshot of a single calendar year. The benefit of diversification and rebalancing to maintain the allocation is most realized over long periods of time, where the decrease in volatility becomes more evident.
Diversification isn’t always a free lunch. The trade-off for lower volatility is sacrificing higher long-term returns from allocating fully to stocks. Compared to our moderate portfolio allocations, a portfolio allocated solely to the S&P 500 had higher returns. It also incurred greater volatility.
The fluctuation in returns for the all-large-cap-stocks portfolios was greater than that of the rebalanced portfolio for almost every time period we looked at. (The one exception was the 25-year period of 1991 to 2015.) This isn’t surprising given the lack of bonds, which are uncorrelated to stocks. While the prospect of higher long-term returns from an all-stock portfolio is appealing, it must be balanced against your ability to psychologically and financially withstand the volatility.
Our models have continuously shown a steep price for panicking. The models treat panicking as switching to an all-bond portfolio whenever the S&P 500 falls by more than 20% on a calendar-year basis and then waiting an entire year before getting back into stocks. We view this as a conservative assumption, as many investors wait even longer after exiting stocks over worries about what might happen.
As of the end of last year, an investor who stayed out of the stock market during 2003 (following a 22% drop in the S&P 500 in 2002) and during 2009 (following a 37% drop in 2008) would have ended 2018 with nearly $460,000 less wealth than an investor who stayed with a diversified portfolio and rebalanced periodically. Not only is this a huge number, it has largely grown in size since we first started modeling the panic scenario in 2014 (“The Danger of Getting Out of Stocks During Bear Markets,” AAII Journal, May 2014).
Another reason not to panic is the ability to grow wealth even if your timing is bad. It didn’t matter if  rebalancing was used, rebalancing wasn’t used, a 60/40 allocation was followed or the portfolio was fully allocated to the Vanguard S&P 500 fund, the returns were higher if someone stayed fully invested than if they panicked. This held true if the portfolio was started in January 2000 or in January 2007.
Consider the later scenario where someone got into the market in January 2007, right at the start of the financial crisis. If this investor panicked in late 2008 and avoided stocks for all of 2009 before getting back into the market in 2010, they would have had $164,579 at the end of 2018. (This assumes the moderate allocation was used with no withdrawals.) This is close to $20,000 less than if they had stayed in and not rebalanced. It is $26,000 less than they would have had by rebalancing.
Had this same investor weathered the volatility by allocating solely to the S&P 500, their portfolio would have risen from a starting balance of $100,000 to $224,892. Would there have been some nerve-racking years in between? Yes, this all-stock portfolio was in the red between 2008 and 2011 before rising back above the $100,000 mark in 2012.
We use our moderate portfolio allocation as an example to show how rebalancing compares to not rebalancing. The strategy can be applied to any allocation an investor chooses to follow. The goal of this ongoing study is to show the performance of portfolios that individual investors could have held in their own accounts, not to track the performance of a specific allocation.
We also show the returns of portfolios following the 60/40 allocation and of a portfolio fully allocated to the S&P 500 to provide benchmark returns. The classic 60% stock/40% bond strategy uses rebalancing, albeit annually instead of episodically.
Those wishing to adjust the allocations can use the spreadsheets included below. They contain year-by-year returns for all of the funds used, inflation data for calculating withdrawals and detailed instructions and notes. The models start in 1988, 2000 and 2007. The latter two show what happened to portfolios that started just prior to the bursting of the late 1990s dot-com bubble and the start of the 2007–2009 financial crisis. We’ve also updated our 25-year rolling-period analysis spreadsheets to include the period of 1994 through 2018. The 1993–2017 spreadsheet includes an adjustment to the return calculations that were published last year.
Complete Data for All Portfolios and Variations
Download the Excel spreadsheets by clicking on each link:
2019 - Rebalancing - 2000 to Present
Portfolio Strategies

Portfolio Strategies
