

Related

AAII Model Portfolios
The portfolio management rules have been constructed to encourage winning stocks to accumulate, while weaker companies are sold.

Wayne Thorp leads a class in AAII's new Essential Investing Video Course. Go to https://www.aaii.com/ves for more information and to subscribe.
Investors took a more cautious view on the prospects of the economy during March, rotating out of economically sensitive sectors such as financials, industrials, basic materials and consumer cyclicals into utilities, technology and non-cyclicals during the month. A more dovish stance by the Federal Reserve and its interest rate policy, a temporary inversion of the yield curve, concerns over a slowing global economy and even the continued negotiations of the U.S.-China trade deal were the backdrop of the short-lived “risk-off” market pause.
Performance for the Model Shadow Stock Portfolio through March 31, 2019, is shown in Figure 1.
Investors favored large-company stocks over smaller-company stocks during March, as is often the case when there is a flight to safety. The S&P 500 index was up 1.9% during March, boosting its year-to-date gain to 13.6% through the first quarter of 2019. In contrast, small- and mid-cap stocks were generally down during March. The S&P MidCap 400 index was down 0.6% during March and is now up 14.5% for the year, while the S&P SmallCap 600 index lost 3.3% during March and is up 11.6% year to date. The Model Shadow Stock Portfolio was down 3.8% during March, lowering its 2019 year-to-date performance from 20.3% to 15.8%. The Vanguard Small-Cap Index fund (NAESX) was down 0.9% during March and has year-to-date performance of 16.1%, while the DFA U.S. Micro Cap fund (DFSCX) was down 3.6% during March and is up 11.6% for this year through the end of March.
The performance of growth versus value-oriented stocks remains mixed. Large-cap growth stocks were up 15.0% for the first quarter of the year versus the 12.2% gain for large-cap value stocks. The pattern is reversed in the mid- and small-cap segments, with mid-cap growth stocks up 14.0% year to date, while mid-cap value stocks are up 15.0%. Small-cap value stocks are up 12.5% year to date, while small-cap growth stocks are up 10.8%.
Even with a long-term perspective, it is helpful to understand the market environment and investor sentiment underpinning the relatively short-term market movements. As we noted in the April 2019 AAII Journal, small-company stocks tend to be more sensitive to interest rates and economic cycles.
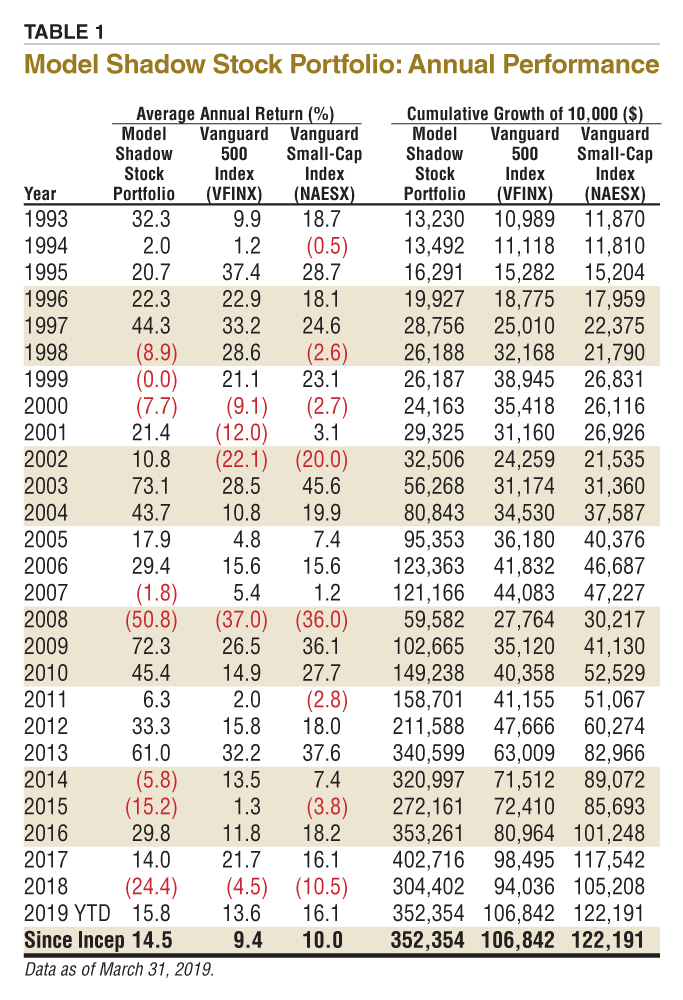
Since its inception in 1993, the AAII Model Shadow Stock Portfolio has a compound annual average return of 14.5% versus the Vanguard 500 Index fund’s (VFINX) gain of 9.4% per year on average over the same period. Over the same period, the Vanguard Small-Cap Index fund posted an average annual gain of 10.0%. A year-by-year perspective on the performance of the Model Shadow Stock Portfolio is provided in Table 1.
Table 2 shows the current stocks in the Model Shadow Stock Portfolio.

The core investment tenets of the Model Shadow Stock Portfolio have been consistent over its history, but the tactics and portfolio management rules have been adjusted over time as we gained experience in managing the real-world micro-cap value model portfolio. The goal was not to prove any one theory of investing, but rather to show how a consistent approach could be followed with a portfolio of stocks and examine and share the problems of managing such a portfolio.
A number of tactical changes have been made to reduce unnecessary portfolio turnover. Frequent buying and selling of these small-company stocks can lead to high expenses. We are not referring to brokerage commissions, which are extremely low using a deep discount broker, but to the cost of the bid/ask spread—the difference between the highest price offered to buy a stock and the lowest price offered to sell a stock at a particular time. It is recommended that members try to get an execution price in between the bid/ask if the spread is wide and make use of limit orders to avoid odd price swings with less liquid stocks. (The Stock Order Guidance segment of the model portfolio rules on AAII.com provides detailed guidance.)
In the quarterly review of the Model Shadow Stock Portfolio in the first quarter this year, Aceto Corp. (ACET) was sold because it had filed for Chapter 11 bankruptcy protection from its creditors, leaving its equity stock worthless. This was the second time in 26 years there has been a bankruptcy in the portfolio, as companies generally get sold because of negative earnings before they go bankrupt. Jackson Hewitt Tax Service was held in the Model Shadow Stock Portfolio when it filed for bankruptcy in 2011.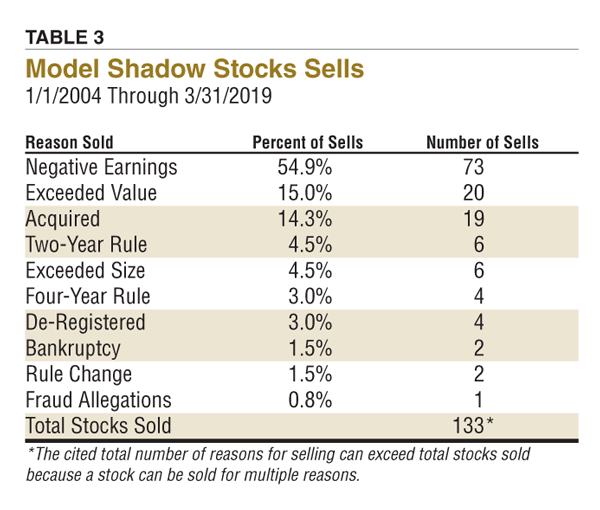
Every stock sold in the Model Shadow Stock Portfolio from 2004 through this year was recently examined; the results are shown in Table 3. Overall, 133 stocks have been sold with 137 reasons cited for selling. The number of reasons exceeds the total number of stocks sold because a stock may be sold for more than one reason. For example, the Alamo Group was sold in the fourth quarter of 2017 because it exceeded both the value and size rules of the portfolio.
The analysis reveals that most stocks—54.9%—have been sold because they violated the negative earnings rule. The Model Shadow Stock Portfolio has excluded and sold stocks with negative earnings from its inception, but the probationary period and analysis developed and evolved over the time. The portfolio management rules have been constructed so that winning stocks (those exceeding size and value limits) are allowed to accumulate without being deleted, while weaker companies are sold. This is an attempt to overcome the natural investor bias (disposition effect) of holding onto losing stocks too long in an attempt to avoid acknowledging a mistake, while selling winners too quickly.
More winning stocks in the Model Shadow Stock Portfolio have been sold because the price-to-book value has become too high (15.0%) or they have been acquired (14.3%) than because they have become too large (4.5%).
The primary investment approach of the Model Shadow Stock Portfolio is expected to hold true, but the tactics will be fine-tuned. Research continually shows that, among individuals and professional investors alike, those with a consistent approach win and those who keep changing strategies lose.
The next quarterly review of the AAII Model Shadow Stock Portfolio will take place around the end of May 2019, after most of the Shadow Stock holdings have announced their quarterly earnings. Any changes to the portfolio will be announced at the time they are made in a special Model Portfolios Update email (sign up at www.aaii.com/email).
AAII Model Portfolios

AAII Model Portfolios

Behavioral Finance

Harvey from MD posted over 7 years ago:
Wayne A. Thorp, CFA from IL posted over 7 years ago:
Dave from FL posted over 7 years ago:
Tom Sullivan from CA posted over 7 years ago:
Jyl Leininger from WA posted over 7 years ago:
Andy Burke from CA posted over 7 years ago:
Max M from VA posted over 7 years ago:
Wayne A. Thorp, CFA from IL posted over 7 years ago:
Max M from VA posted over 7 years ago:
John from Kansas posted over 6 years ago:
DAVID B from MI posted over 5 years ago:
JEAN H from IL posted over 5 years ago:
You need to log in as a registered AAII user before commenting.
Log InCreate an account