


Derek Hageman leads a class in AAII's new Essential Investing Video Course. Go to https://www.aaii.com/ves for more information and to subscribe.

Featured Tickers:
Deciding which dividend ETF to invest in depends on both the characteristics being sought and the willingness to look closely at the strategy a fund is designed to follow.
As of August 2019, there are more than 40 domestic dividend-paying exchange-traded funds (ETFs) that explicitly list “dividend,” “income” or “yield” in their name. Each of these funds also has a minimum of $100 million of assets under management (AUM)—considered to be a benchmark for expected survivability—and invest in U.S. companies. Dividend-seeking investors who prefer ETFs may find one or more of these funds to be suitable investments.
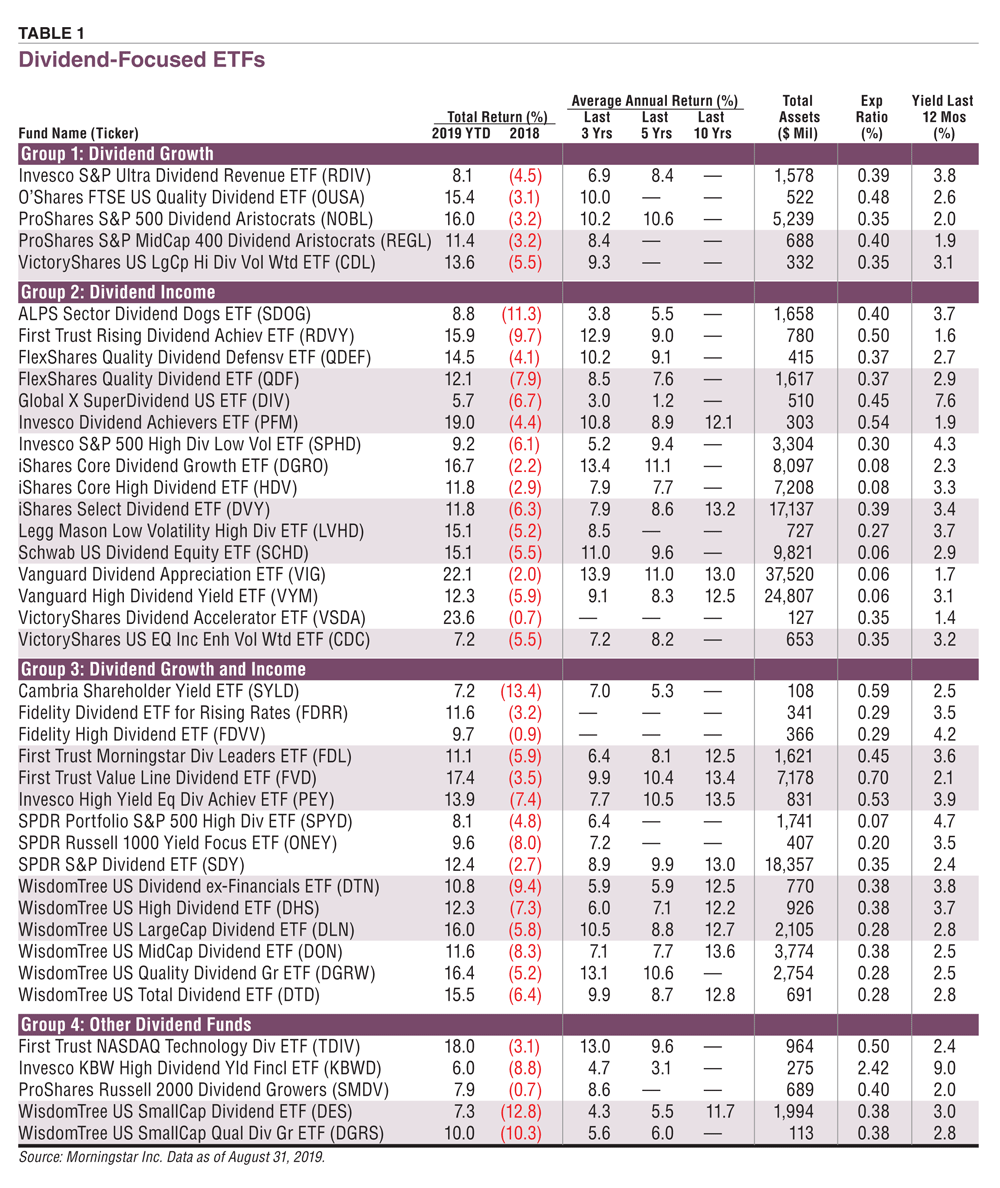
To identify funds for this article, I searched the universe of U.S.-listed ETFs using data provided to us by Morningstar. Out of an ETF universe of more than 2,300 funds, my goal was to find funds solely focused on dividends. So, I narrowed the list of funds to those whose names contained key words that I associate with dividends: “income,” “yield” and, naturally, “dividend.” Based on these keywords, I was able to reduce the list to 262 funds. After applying a few more filters to include ETFs investing in U.S. companies with a minimum fund size and exclude those focused on real estate investment trusts (REITs) and master limited partnerships (MLPs), the final dividend ETF list was ready, as shown in Table 1. (Distributions from REITs do not qualify for the reduced tax rates on dividends; and while there can be tax benefits to MLP distributions, they are also not qualified dividends.)
 Using Morningstar’s ETF classification system, I segmented the dividend funds into four groups: growth, income, growth and income and other. Dividend growth ETFs generally focus on finding high-quality companies that not only pay dividends but are also reasonably expected to grow their dividend each year. These funds are less focused on finding the highest dividend-yielding stocks. On the other hand, dividend income ETFs typically employ different strategies to seek stocks with higher yields. Dividend growth and income ETFs use a balance of these other two strategies. They seek companies that both have higher-than-average dividend yields and grow their dividends. It is important to note that there is some overlap between the strategies followed by the funds in these different groups. The other dividend ETF group contains funds that follow more tactical strategies based on sector specialization or a desire to have more exposure to small-cap companies.
For each fund group, stocks in the ETFs were classified as being either growth or value. Value stocks have low price-to-book, price-earnings and price-to-sales ratios. Growth stocks have high three-year increases in earnings and revenues and strong 12-month price momentum. Stocks that fall between the two categories are a blend of growth and value categories based on which style they most likely resemble.
A challenge for investors seeking dividend income is choosing which fund to invest in. The decision depends on both the characteristics being sought and the willingness to look closely at the strategy a fund is designed to follow. In this article, I discuss some of the basic differences between the various dividend-centric ETFs.
Before analyzing each group, I have three general observations about the ETFs in Table 1. First, in 2018, none of the funds had positive returns, regardless of strategy. Second, for this year, all of the funds show positive returns through August 2019. Finally, most of the funds have been around for fewer than 10 years. (All of the data used in this article is as of August 31, 2019, unless specifically stated otherwise.)
Group 1: Dividend Growth Nobility
If the goal is to invest in high-quality dividend-paying companies in the U.S. that have not just paid dividends but have also grown them consistently, dividend growth ETFs are what should be looked at. These funds, shown in Group 1 of Table 1, seek stocks of large- and mid-cap dividend-paying companies that are expected to pay and grow their dividends. In general, the funds have either a value or blend (value and growth) factor preference. Group 1 funds hold companies like Johnson & Johnson (JNJ), Walmart Inc. (WMT), Verizon Communications Inc.  (VZ), Coca-Cola Co. (KO) and Chevron Corp. (CVX) at their core.
ProShares offers the S&P 500 Dividend Aristocrats ETF (NOBL), the largest fund in this group with $5.2 billion in assets. The fund invests in large, high-quality companies that have paid and grown their dividends for at least 25 consecutive years. ProShares S&P 500 Dividend Aristocrats has the highest return for Group 1 year to date, at 16.0%, and the highest three- and five-year average annual returns, at 10.2% and 10.6%, respectively. A key reason may be the expense ratio. The fund has one of the lowest expense ratios in the group at 0.35%, or $35 per year in expenses for every $10,000 invested.
In comparison, O’Shares FTSE US Quality Dividend ETF (OUSA) is the costliest of the group, with an expense ratio of 0.48%. ProShares offers a mid-cap blend fund, ProShares S&P MidCap 400 Dividend Aristocrats ETF (REGL), that invests in high-quality, mid-cap companies that have paid and grown dividends for at least 15 consecutive years. The fund’s investment strategy seeks to capture most of the gains of rising markets and fewer of the losses in falling markets.
On average, the ETFs in Group 1 have the lowest dividend yields relative to the other three groups, but the highest average annual three- and five-year returns. Interestingly, all of the dividend growth-focused ETFs were launched in 2013 or later, so most of them are only able to show three-year returns. The decision to allocate to them should be based on the expectation that such funds will be able to achieve outperformance over the long term with the understanding that all return anomalies go through periods during which they underperform.
Group 2: High Dividend Yield
The dividend income ETFs in Group 2 in Table 1 typically employ different strategies to increase dividend yield. To achieve higher yields, Group 2 funds usually invest in lower-quality and higher-risk companies. In comparison to the other groups, the dividend income-focused group has the highest return year to date and the lowest average expenses. Expense ratios for many of these funds are near or below 0.10%. Surprisingly, this group does not have the highest average 12-month dividend yield, outpaced slightly by the Group 3 dividend growth and income group. There are many similarities among the funds in this group, with most of them seeking opportunities in the large-cap value space. Group 2 funds hold companies like Vector Group Ltd. (VGR), Invesco Ltd. (IVZ), Helmerich & Payne Inc. (HP) and Occidental Petroleum (OXY) at their core.
The largest funds in this group are from Vanguard, with the Dividend Appreciation ETF (VIG) at $37.5 billion in assets and the High Dividend Yield ETF (VYM) at $24.8 billion. Both have the lowest expense ratios of the Group 2 funds, at 0.06%, and are among the funds with the highest 10-year average annual returns in the group, at 13.0% and 12.5%, respectively. BlackRock’s iShares Select Dividend ETF (DVY) is the third-largest fund in the group, at $17.1 billion in assets, and has the highest 10-year return, at 13.2%.
The Global X SuperDividend US ETF (DIV) has the highest dividend yield in Group 2, at 7.6%, but the lowest return year to date, at 5.7%. The Global X SuperDividend fund accesses 50 of the highest dividend-paying equities in the U.S., potentially increasing the portfolio’s yield. Global X SuperDividend’s underlying index methodology screens for stocks that have exhibited low betas (low levels of price volatility) relative to the S&P 500 index in an effort to produce low-volatility returns.
Group 3: Combining the Best of Both Worlds
If the goal is to satisfy demand for balance between potential dividend growth and higher-than-average yield, then Group 3’s dividend growth and income ETFs in Table 1 are what should be looked at. Group 3 funds seek to identify U.S. large- and mid-cap dividend-paying companies that have a long track record of success. All the funds in this group are value oriented except for the WisdomTree U.S. Quality Dividend Growth ETF (DGRW). This fund targets a large-cap blend strategy.
 Group 3 funds have the longest tenure compared to the other groups. Nine funds from Group 3 have 10-year average annual returns in the double-digits. Of all the Group 3 funds, the First Trust Value Line Dividend ETF (FVD) is the longest-running fund, with an inception date going back to 2003. Interestingly, the First Trust ETF also has the highest fees in this group at 0.70%.
The WisdomTree U.S. MidCap Dividend ETF (DON) has the highest 10-year average annual return in Group 3 at 13.6%. Its expense ratio is 0.38%. The Invesco High Yield Equity Dividend Achievers ETF (PEY) has the group’s second-highest 10-year return at 13.5%. Its expense ratio is 0.53%. The First Trust Value Line ETF’s 10-year annualized return of 13.4% is arguably reduced by its comparatively high expense ratio. First Trust Value Line uses Value Line’s safety ranking to identify stocks, while Invesco High Yield Equity Dividend Achievers targets Nasdaq-listed dividend payers and WisdomTree U.S. MidCap focuses on mid-cap stocks.
State Street’s SPDR Portfolio S&P 500 High Dividend ETF (SPYD) is a low-cost fund that seeks to provide a high level of dividend income and the opportunity for capital appreciation by tracking the performance of the 80 highest-yielding stocks in the S&P 500. Based on this strategy, the fund has been successful, offering the lowest fees in Group 3, at 0.07%, and the highest dividend yield over the last 12 months, at 4.7%.
Group 4: Specialty Sector Dividend Funds
The other dividend-focused ETFs, shown in Group 4 in Table 1, do not fit nicely into any of the aforementioned groups. Some of these funds are tactical.
First Trust and Invesco offer specialty funds focused on specific sectors, such as technology and financials, respectively: First Trust NASDAQ Technology Dividend ETF (TDIV) and Invesco KBW High Dividend Yield Financial ETF (KBWD).
Compared to funds in Groups 1, 2 and 3, the specialty funds are considered riskier because they are not as diversified in their holdings.
Pinpointing the Dividend-Oriented Funds
As previously stated, to identify funds for this article I searched the universe of U.S.-listed ETFs for funds with dividend, income or yield in their name. Out of an ETF universe of more than 2,300 funds, there were 262 funds that explicitly list dividend, income or yield in their name, excluding those focused REITs and MLPs. Next, I filtered the 262 ETFs to identify those that have assets under management (AUM) of at least $100 million, which whittled the list to 119 funds. At this point, there were 65 funds with dividend in their title, 34 with yield listed and 20 names focused on income.
 The next step was a very manual process. I started reviewing the funds with yield in their name. In doing so, I quickly identified that 32, or 94%, of the 34 funds with yield in their name focused on fixed-income securities, specifically, high-yield corporate bonds. The process for identifying funds with income in their name provided similar results. Only one fund with income in its name invests in equities, while the others invest in taxable or municipal bonds. Filtering the funds with dividend in their name was fine-tuned by excluding those ETFs invested in international equities outside the U.S. (I excluded international funds to increase the odds of identifying ETFs investing in companies paying qualified dividends.) This filter reduced the dividend list by 27 names to 38 ETFs. The final list of 41 dividend-focused funds comprised 38 ETFs with dividend in their name, two with yield in their name and one fund with income in its name.
There may well be additional funds in existence that are dividend-oriented funds. Identifying them would require going through factsheets and/or prospectuses on a fund-by-fund basis—a time-consuming process that was outside of the scope of this article.
Related

Investor Professor
Three Pillars for Successful Dividend Investing
Related

Mutual Funds
Tracking the S&P 500 With Mutual Funds and ETFs
Discussion
FREE REPORT

Get your free copy of our special
report analyzing the tech stocks
most likely to outperform the
market.
Ms. Sneha Joshi from VA posted over 6 years ago:
Dave G from WA posted over 6 years ago:
Michael Will. ## 10974119 from New York posted over 6 years ago:
Jean from AAII posted over 6 years ago:
Kevin from CA posted over 6 years ago:
Jim M from NJ posted over 6 years ago:
Robert H from California posted over 6 years ago:
Robert H from CT posted over 6 years ago:
Ms. Sneha Joshi from VA posted over 6 years ago:
Ed C from NM posted over 6 years ago:
Frank S. from Texas posted over 6 years ago:
Tom from OH posted over 6 years ago:
Michael Daillak, CPA from CA posted over 6 years ago:
Michael Daillak, CPA from CA posted over 6 years ago:
Dave G from WA posted over 6 years ago:
Michael Daillak, CPA from CA posted over 6 years ago:
BARRY E from CA posted over 5 years ago:
CRAIG & NANCY B from CA posted almost 2 years ago:
You need to log in as a registered AAII user before commenting.
Log InCreate an account