


Related
AAII InvestoGraphic
Our revamped guide to ETFs gives more direction on how to choose the right ETF for your situation by focusing on three types of investor personas.
by AAII Staff | August 2019

For the first time since we started publishing our annual guide to exchange-traded funds (ETFs) 16 years ago, we are revising it in a significant way. The change is being made as part of an ongoing revamp of how we at AAII provide information about mutual funds and ETFs.
In putting together this year’s guide, we took the approach of considering what information ETF investors need in order to make better decisions when determining which fund to own. We made the emphasis on “how to choose” an ETF to help you—and your fellow AAII members—be better able to identify what information to consider.
This led us to focus on three types of investors. The first is someone who is new to ETFs. We explain how ETFs differ from mutual funds, offer ideas on how to build a portfolio of ETFs based on your tolerance for risk and discuss how to buy them. The second is a long-term investor. We highlight the key metrics to focus on as well as provide data on many of the widely held stock, real estate and bond funds.
| More ETFs and Expanded Data | |
|---|---|
Go to www.aaii.com/etf-guide for our expanded coverage:
|
We also delve into no-commission ETFs and provide a framework for judging when paying a brokerage commission may be the cheaper option. Several brokers have expanded the number of no-commission ETF offerings they provide to clients over the past few years. While we don’t think investors should limit themselves to funds on these lists, they should not be ignored either. For investors with small accounts or who are dollar cost averaging with smaller amounts (e.g., monthly contributions of a few hundred dollars to an individual retirement account or a Roth IRA), no-commission ETFs can work well. For the first time, we’re providing a comparison of what each broker provides. Where possible, we’ve included notes on restrictions—such as minimum holding periods—for those of you intending to use these ETFs for shorter-term trading strategies.
The short-term investor is the third persona we’re addressing in this year’s guide. Those of you who prefer more active or tactical strategies will find a section devoted to your interests. We highlight some of the key characteristics of importance to those using trading strategies and discuss two sector rotation strategies.
Regardless of the type of ETF investor you are, it’s important to know what index the exchange-traded fund is tracking (the same is true for passively managed mutual funds). You’ll learn how to research an index below. With the growth of ETFs has come a proliferation of indexes for them to track. While some indexes are very familiar, such as the S&P 500 index, others are not. Fortunately, in many cases, finding the index methodology that these ETFs are based on requires a simple online search. We show you where to look.
On AAII.com, we’re continuing to provide our comprehensive listing of ETFs. Our online tools allow you to compare an ETF against its peers and to drill down to learn more about a specific ETF. Those of you who have used our guide in the past may notice a difference in some of the categories; we’re now using Morningstar’s fund categories. Morningstar provides our data and changing to their categorizations offers more standardization with ETF categories you may see elsewhere. (All AAII guides can be accessed by clicking on the “Investing” tab near the top of any page on AAII.com.)
The price war we’ve seen over the past several years has continued. Earlier this year, Vanguard lowered the expense ratios on several of its ETFs. The Vanguard S&P 500 ETF (VOO) now has a razor-thin expense ratio of 0.03%.
As low as this expense ratio may seem, there are even lower-cost ETFs available. This past April, SoFi launched the Select 500 ETF (SFY) with a 0% expense ratio for at least the first year. The fund’s expense ratio is technically 0.19% but the fee is currently being waived. It is not a traditional S&P 500 ETF. Rather, it weights the S&P 500’s components by three growth factors.
Not to be outdone, Salt Financial waived the 0.29% expense ratio on its new Low truBeta US Market Fund (LSLT) and is contributing an additional 0.05% of average daily net assets on the first $100 million in net assets invested.
The 0% expense ratios are an attempt to gain attention by ETF newcomers SoFi and Salt Financial. It’s no surprise that they would do so: The ETF universe is crowded, with BlackRock, State Street and Vanguard controlling the majority of assets.
We’re also seeing an escalation in the price war on the broker side. Fidelity, Schwab and TD Ameritrade have all expanded their number of commission-free ETFs offered.
Beyond the price war, the U.S. Securities and Exchange Commission (SEC) green-lighted Precidian Investments’ ActiveShares. These non-transparent actively managed ETFs will only disclose their holdings on a quarterly basis, instead of daily like traditional ETFs. It’s worth noting that Precidian spent years trying to get the SEC to sign off on its idea. Furthermore, a previously existing type of non-transparent ETFs, Eaton Vance’s NextShares, have failed to gather a large amount of investor dollars so far.
Overall, the ETF industry continues to grow. The Investment Company Institute tabulated total exchange-traded product assets, which include exchange-traded notes (ETNs), as being $3.7 trillion at the end of May 2019. This is a 4.9% increase over the same period a year ago.
The first thing investors who lack familiarity with ETFs or otherwise are new to investing should understand is what they are.
Exchange-traded funds and mutual funds are pooled investments. They are professionally managed investment vehicles composed of assets purchased with investment dollars from groups of investors. Shareholders of both funds have a claim on underlying assets tied to the number of shares they own.
While ETFs and mutual funds share many similarities, there are also structural differences separating them. Mutual funds are bought and sold directly from the fund provider or through an intermediary, such as a broker. Dollars used to purchase mutual fund shares go into the fund’s assets. Those in the industry refer to such dollars as “inflows.” Proceeds from the sale of mutual fund shares are paid with dollars from the fund’s assets and are referred to as “outflows.”
ETFs, on the other hand, are bought and sold on the open market. Dollars spent on purchases or received from sales do not flow in and out of the funds’ assets, rather they go to the selling or come from the buying shareholders. Intermediaries, known as authorized participants (APs), transact with the fund provider to keep an ETF’s share price close or even to the underlying value of its assets (known as the net asset value, or NAV). APs are large institutional investors that purchase and redeem creation units. Creation units are blocks of 25,000 to 200,000 shares. This system of creation units enables the inflows and outflows of an ETF’s assets to mimic the demand for its shares.
Because ETFs are bought and sold on the open market just like a stock, their prices fluctuate throughout the trading day. Conversely, transactions in mutual funds are only completed at the end of the trading day. This difference leads to ETFs potentially trading above (at a premium) or below (at a discount) to their net asset value. Mutual funds, conversely, are bought and sold at their stated NAV.
The pooling of assets for both types of funds causes both capital gains, dividends, interest payments (e.g., from a bond) and other types of income to flow through to the shareholders. ETFs often reduce the recognition of capital gains by using “in-kind” transactions when making portfolio changes. These transactions involve giving APs actual investments from the portfolio instead of cash or shares of the ETF. (Mutual funds also have the ability to use in-kind transactions.) Shareholders of ETFs and mutual funds have no control over the timing or amount of changes in a fund’s portfolios, much less the potential tax implications of those actions.
Most mutual funds are actively managed. A portfolio manager or a team of portfolio managers determines which assets the fund will invest in. Most exchange-traded funds are passively managed. They base their portfolios on an underlying index. Some mutual funds are passively managed, and a relatively small number of ETFs are actively managed. The use of in-kind distributions and passive management generally leads to ETFs being more tax efficient.
Most exchange-traded funds use passive strategies, meaning they are designed to mimic the performance of an index. Some ETFs hold all of the securities listed in an index, while others use sampling strategies to mimic the returns and volatility of the index. A sampling strategy involves holding some, but not all, of an index’s components.
Passively managed ETFs will tell you what indexes they follow. This information is listed in the fund’s prospectus, which can be found on the fund family’s website (e.g., iShares.com, SPDRs.com, etc.). The information is also included in our expanded fund listings spreadsheet at AAII.com.
Merely knowing what index an ETF follows doesn’t tell you what the index is designed to do. Even if the name looks familiar, you may not know how it differs from other similar-sounding indexes. For instance, the S&P 500 Growth index is composed of the approximately 300 companies with the highest sales and earnings growth among S&P 500 companies. Its components overlap with those of the S&P 500 Value index. The S&P 500 Pure Growth index differs by holding only the members of the S&P 500 with the highest growth rates. Its holdings are completely different than those of the S&P 500 Pure Value index.
Identifying what the index is and the methodology it follows (including how often it is rebalanced and/or reconstituted) requires going to the index provider’s website. A simple way to find it is to type the index’s name and the word “methodology” into an online search engine, such as Google. If you wanted to take a closer look at the FTSE Europe index, the index tracked by Vanguard FTSE Europe ETF (VGK), you would do an online search for “FTSE Europe index methodology.” This would lead you to FTSE’s website with information about the index.
Listed below are the websites for the major index providers. Many of them also provide fact sheets, which provide high-level overviews of their indexes.
Bloomberg and Bloomberg Barclays
www.bloomberg.com/professional/product/indices
CRSP
www.crsp.com/products/investment-products
FTSE Russell
https://www.ftserussell.com/index
Intercontinental Exchange (ICE)/ICE BofAML
https://www.theice.com/market-data/indices
Markit iBoxx
https://products.markit.com/indices/UCITS/Indices.aspx
MSCI
https://www.msci.com/index-solutions
Nasdaq
https://indexes.nasdaqomx.com (Click on “Indexes”)
S&P Dow Jones Indices
https://us.spindices.com
ETFs follow a variety of strategies. The largest ones track traditional stock and bond indexes, such as the S&P 500. The smallest ones can follow esoteric or very specific strategies, such as the Loncar China BioPharma ETF (CHNA). As its name implies, the fund invests in companies focused on China’s growing drug industry.
While it can be tempting to seek an advantage by buying a fund targeting a very specific industry, academic research has shown that the biggest impact on portfolio returns comes from the allocation decisions made (i.e., the percentage of total portfolio dollars allocated to stocks, the percentage allocated to bonds, etc.). Adhering to a well-thought-out allocation strategy over the long term will have a more beneficial impact than trying to make tactical decisions based on what you think will happen in the future.
A starting point for those looking to build a portfolio of ETFs is AAII’s Asset Allocation Model, shown in Figure 1. This model provides sample allocations for three types of investors: aggressive, moderate and conservative. The allocations range from 90% stocks/10% bonds for aggressive investors to 70% stocks/30% bonds for moderate investors to 50% stocks/50% bonds for conservative investors.
Table 1 provides examples of ETFs that could be used to achieve these allocations. They mimic the mutual funds tracked for our Asset Allocation Model. These ETFs are large in size for the category (as measured by assets under management, or AUM) and have low expense ratios (the fees charged for operating the fund). They also tend to follow well-known, traditional stock and bond indexes.
Buying an ETF is the same as buying a stock. The process and costs are the same (though several brokers waive commissions on certain ETFs). An investor simply needs to know the ticker symbol and the number of shares to be purchased. Limit orders, which specify the maximum price to be paid for a buy order or the minimum price accepted for a sell order, are suggested to protect against sudden, unexpected changes in the share price.
When placing an order to buy an ETF, it is important to look at the current bid/ask spread. The bid is the price that buyers are willing to pay. The ask is the price that sellers are demanding. Frequently traded ETFs tracking well-known indexes such as the S&P 500 usually trade at bid/ask spreads of one to two cents per share. Other ETFs may trade at wider bid/ask spreads. The larger the spread between the bid and the ask, the more expensive it will be to transact in the ETF and the lower your potential returns may be.
Long-term investors should seek out ETFs they can hold for years without having to worry much about the fund’s sustainability, performance or tax impacts. Allocation decisions matter greatly if the intent is to limit the number of transactions. Table 2 lists large broad-based index ETFs suitable for long-term investors.
When building a portfolio of ETFs (or mutual funds), we believe it is helpful to use a top-down approach. Determine what asset classes you want exposure to and then find the best funds targeting those asset classes. In contrast, a bottom-up approach seeks to build a portfolio from the best identifiable ETFs.
There are several parameters to consider when evaluating a ETF for a long-term position. Performance is an obvious one. The fund’s five-year returns should be above or similar to its category averages or its direct peers. Peer comparisons would be warranted for ETFs following a narrow version of a broad strategy such as value or dividend growth. Year-by-year returns also warrant being examined for unusual swings. An ETF with a high five-year return but large variances in annual returns relative to its category may be less desirable than one with a slightly lower five-year return but more stable year-by-year returns relative to its category averages.
One useful measure is the risk index. The risk index indicates how volatile a fund is relative to its category and all ETFs. A risk index of 1.00 denotes average risk. Values above 1.00 indicate greater risk than average, while values below 1.00 indicate less risk than average. A higher risk index reveals greater volatility in a fund’s recent (three-year) returns. It can suggest that the fund is more affected by certain market conditions and/or that you can expect greater fluctuations in the year-to-year returns. A fund with good long-term performance may not be suitable for a long-term investor who is unable to tolerate its higher level of volatility.
Assets under management, or simply AUM, matter because they give insights into whether a fund is likely to stay around or is at risk of being closed or merged into another fund at some point in the future. There is no single dollar amount at which a fund will be shut down, but ETFs with AUM under $100 million and particularly below $50 million should be viewed with caution. Medium- to large-size funds have AUM of $500 million or more. The largest ETFs have AUM in excess of $100 billion. [There is a significant gap in terms of AUM at the very top. The largest ETF, SPDR S&P 500 ETF (SPY), has $268 billion in assets versus $61 billion for the 10th largest ETF, iShares MSCI EAFE ETF (EFA).]
If the ETF will be held in a taxable account, consider the tax-cost ratio. The tax-cost ratio measures how much an ETF’s annualized return is reduced by the taxes paid on distributions, assuming the maximum marginal tax rate. The lower the ratio, the more tax-efficient the ETF. While most ETFs are tax efficient, not all are. For instance, the SPDR NYSE Technology ETF (XNTK) has a three-year tax-cost ratio of 2.5%. Investors who held the fund in a taxable account saw their annualized returns reduced by 2.5 percentage points because of taxes. The tax-cost ratio is not applicable if the ETF is held in a tax-preferred account such as a traditional IRA or a Roth IRA, but it does signal potentially higher levels of turnover.
Speaking of costs, the expense ratio matters regardless of the type of account the fund is held in. The expense ratio is the sum of administrative fees and adviser management fees divided by the average net asset value of the ETF. It is charged each and every year you own the fund. ETF shareholders do not get billed for the expense ratio, rather it is taken out of a fund’s assets, diminishing the return that shareholders ultimately realize.
Expense ratios are shown in a percentage format. A 0.10% fee will cost you $1 for every $1,000 invested in a fund. A 0.50% fee will cost you $5 for every $1,000 invested. The more invested and/or the higher the expense ratio, the more you will pay every year. For example, a $5,000 investment in an ETF with a 0.50% expense ratio will incur an annual cost of $25 per year. This cost is in addition to any brokerage commissions and trading costs.
You can calculate the annual cost you will incur by simply multiplying the expense ratio by the amount you have invested or plan to invest. The result of the calculation can help you determine whether or not it makes sense to pay the brokerage commission for an ETF instead of relying solely on what is on the no-commission ETF menu. Let’s say an ETF on the no-commission list has an expense ratio of 0.10% but a similar ETF not on the list has a 0.05% expense ratio. Let’s also assume you want to allocate $10,000 to it.
During your first year, you will lose $10 to expense ratios on the commission-free fund ($10,000  (EFA) 0.10% = $10). By opting for the lower-cost fund, you will lose $5 to the expense ratio ($10,000 (EFA) 0.05% = $5) and an additional $4.95 (or $6.95) in brokerage commissions. During the second year, assuming the ETFs’ share prices are unchanged, you will again spend $10 on expense ratios for the commission-free fund but just $5 in expenses on the commission fund. Your total costs will now be higher on the no-commission ETF ($10 + $10 = $20) than for the commission ETF ($5 + $5 + $4.95 = $14.95).
The savings will continue to grow each and every year you own the ETF with the lower expense ratio, even after accounting for the brokerage commission. After five years, you will have saved $20 after accounting for what you spent on the purchase of the ETF excluded from the commission-free menu.
The simple analysis assumes the NAV of both ETFs is unchanged. In the real world, the returns between the two funds will differ depending on whether they follow the same index and their relative expense ratios. As the size of your investment in an ETF grows, so does the amount you pay in expenses ratios on an absolute-dollar basis.
Brokerage commissions are more of a consideration for those intending to hold ETFs for shorter-term periods, such as less than a year. For investors who fall into this category, other considerations can also be significant.
One of those considerations is trading volume. The ability to buy and sell quickly and without impacting the fund’s price increases is important. Those following strategies with higher levels of turnover may find it beneficial to gravitate toward ETFs with higher trading volumes. Such funds are more likely to also have narrower bid/ask spreads, which reduce transaction costs. (The bid is the maximum price buyers are willing to pay and the ask is the minimum price sellers are willing to accept.)
The market return differential also matters. The market return differential is the difference between the return realized by the investor and the change in an ETF’s net asset value (NAV). In theory, both should be the same. In reality they can differ, with an investor’s return being higher or lower than the change in the value of the underlying net assets. The greater the difference, the more likely it may be for an ETF to trade at a premium or discount to its NAV. Any reversion in the fund’s price back to its NAV will impact the return you realize from the trade. Therefore, it can be advantageous to put more focus on funds with a smaller market return differential.
The no-commission ETFs can be a starting point for those seeking to reduce the cost of more frequent trading. Restrictions on which ETFs are included limit the number of funds to choose from. Active traders should make sure they understand the length of the minimum holding periods, if they exist. The box below provides an overview of the various no-commission ETF offerings by brokerage firms.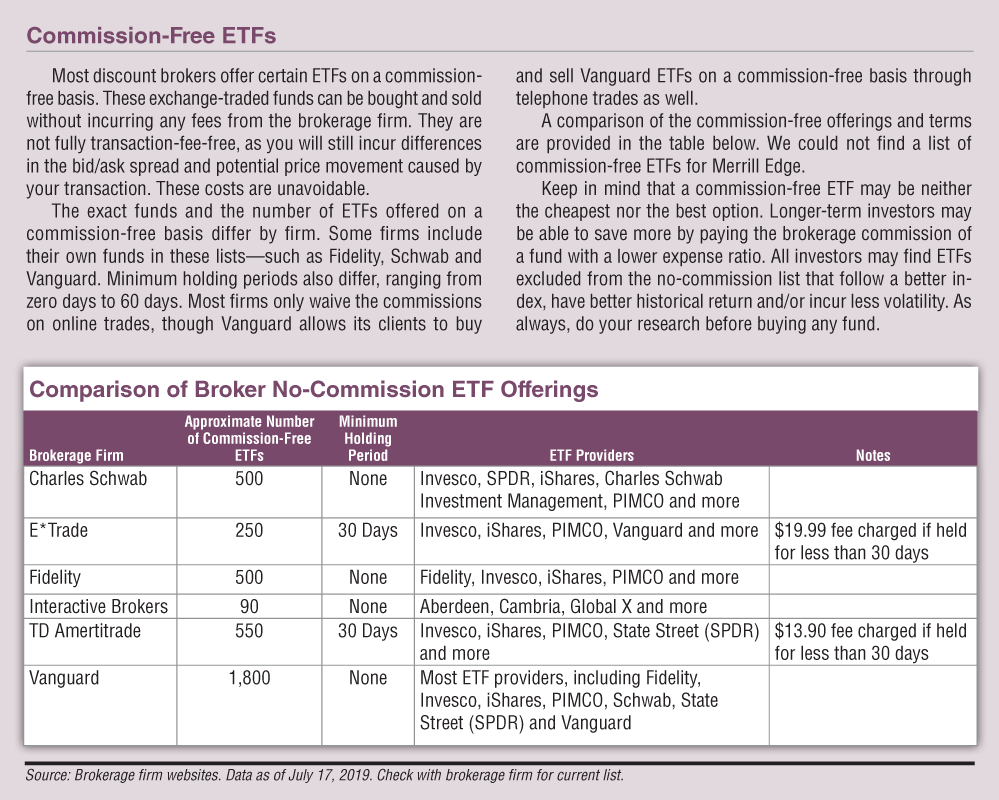
There is evidence showing that rotational strategies can work for sector-oriented ETFs. Sam Stovall, the chief equity strategist at CFRA Research, has found that a six-month rotational strategy beats the S&P 500. His strategy calls for allocating to the health care and consumer staples sectors between May and October. For the months of November through April, the strategy calls for shifting to consumer discretionary, industrials, materials and technology. In both cases, the portfolio is allocated equally to each sector fund.
Doug Ramsey at Leuthold Group tracks what he calls the Bridesmaid Strategy. A fund representing the second-best-performing S&P 500 sector is bought and held for a full year. It is then replaced with the new bridesmaid: the fund now ranking second in terms of trailing 12-month performance. The strategy can also be used with semiannual, quarterly and even monthly rebalancing.
Keep in mind that neither strategy beats the market every single year. Plus, all tactical strategies require the discipline to stick with them. Even when they seem easy to follow, the actual volatility of returns experienced and the buy and sell decisions they call for making can be hard to deal with in real-world situations. With these caveats given, Table 3 lists the largest and most-widely held sector funds.
Most of the information shown in Tables 1, 2 and 3 is provided by Morningstar Inc. or is calculated from the data the company provided. Any data source has the potential for error, however. Before investing in any exchange-traded fund or exchange-traded note, you should read the prospectus, annual report and quarterly reports.
When a dash appears in an ETF listing, it indicates that the number was not available or does not apply in that particular instance. We did not compile bull and bear ratings for ETFs not operating during the entire bull or bear market period.
Figures given for the category averages are calculated based on the entire universe of ETFs, not just those included here in the print version of this guide.
The following provides an explanation of some of the key terms and statistics. Descriptions of all terms are provided in the online version of this guide.
Index Fund: The letter “I” before a fund’s name indicates that the fund is designed to mimic the performance of an index, such as the S&P 500; the amounts invested in each security are proportional to its representation in the index that the fund tracks. The online version of this guide names the indexes tracked by these funds.
Structure: The letters “OE” indicate that the ETF is an open-ended investment company. “OE” includes exchange-traded funds, exchange-traded managed funds (ETMFs) and mirror open-ended funds as they report NAV returns.
The letters “UIT” stand for unit investment trust. A unit investment trust is a registered investment company that buys and holds a generally fixed portfolio of stocks, bonds or other securities. “Units” in the trust are sold to investors (unitholders) who receive a share of principal and dividends (or interest). A UIT has a stated date for termination that varies according to the investments held in its portfolio.
Total Return (%): Returns are based upon changes to a fund’s net asset value (NAV) or, where designated, share price (market return), assuming the reinvestment of all income and capital gains distributions (on the actual reinvestment date used by the fund) during the period. The return calculation is net of expenses. The year-to-date, 12-month, three-year and five-year returns are calculated through June 30, 2019. The three- and five-year returns are presented on an annualized basis. Bull market returns are for March 1, 2009 through June 30, 2019. Bear market returns are for November 1, 2007, through February 28, 2009. Returns that are in the top 25% of all ETFs within the investment category are shown in boldface.
Yield (%): The total annual income distributed by the ETF divided by the period-ending net asset value. Calculated on a per-share basis, this ratio is similar to a dividend yield and would be higher for income-oriented funds and lower for growth-oriented funds. The figure only reflects income, not total return.
Tax-Cost Ratio (%): Measures how much an ETF’s annualized return is reduced by the taxes paid on distributions, assuming the maximum marginal tax rate. A tax-cost ratio of 0.0% indicates that the fund did not make any taxable distributions. If a fund had a 2.0% tax-cost ratio, it means that on average each year, investors lost 2.0% of their assets to taxes. The lower the ratio, the more tax-efficient the ETF. The ratio is calculated using the last three years of data.
Risk Index—Category and Total: The category risk index is the standard deviation of an ETF’s return divided by the standard deviation of return for the average ETF in the category. The total risk index is the standard deviation of an ETF’s return divided by the average standard deviation of return for all funds. Standard deviation is a measure of return volatility and is computed using monthly returns for the last three years. A risk index of 1.00 denotes average risk. Values above 1.00 indicate greater risk than average, while values below 1.00 indicate less risk than average. Risk numbers that are in the lowest 25% of all funds within the investment category are shown in boldface.
Total Assets ($ Mil): Presented as millions of dollars, this is the amount of total assets an exchange-traded fund has under management (AUM). This is the total value of the fund’s portfolio. Size can be affected by the age of the fund, the index it follows and the number of competitive funds.
Average Daily Trading Volume (Thousands): Average daily volume of shares traded for the last three-month period through June 30, 2019.
Portfolio (%)—Stocks: The percentage of assets held in common stocks, both domestic and foreign. Bonds: The percentage of assets held in debt securities that are not convertible into common stock. Other: The percentage of assets held in futures, options, preferred stock, trusts or other alternative securities. Cash: The percentage of assets held in cash or cash equivalents.
Percent of Portfolio in Foreign Issues: The percentage of the ETF’s assets that are invested in foreign stocks and foreign bonds.
Portfolio Turnover Ratio (%): A measure of the trading activity of the ETF, which is computed by dividing the lesser of purchases or sales for the year by the monthly average value of the securities owned by the fund during the year. Securities with maturities of less than one year are excluded from the calculation. The result is expressed as a percentage, with 100% implying a complete turnover within one year.
Number of Holdings: The total number of individual securities held by the ETF. These can include stocks, bonds, currencies, futures contracts and option contracts. This figure is meant to be a measure of portfolio risk: The lower the number, the more concentrated the fund is in a few issues. Some ETFs may hold fewer shares than the index’s name would suggest if the ETF’s manager believes they can mimic the returns of the index without holding all of the securities in it.
Percent of Portfolio in Top 10 Holdings: Investments, expressed as a percentage of the total portfolio assets, in the ETF’s top 10 portfolio holdings. The higher the percentage, the more concentrated the fund is in a few companies or issues, and the more the fund is susceptible to market fluctuations in those few holdings. Used in combination with the number of holdings, this figure can indicate how concentrated an ETF is.
Expense Ratio (%): The sum of administrative fees and adviser management fees divided by the average net asset value of the ETF, stated as a percentage. Brokerage costs incurred by the fund are not included in the expense ratio, neither are the commissions you may pay to buy and sell shares. Expense ratios that are in the lowest 25% of all funds within the investment category are shown in boldface.
Why Aren’t There More Active ETFs?
Leveraged ETFs: Multiplying by the Unknown
An Inside Look at Exchange-Traded Funds
ETFs and ETNs: Knowing What You Own
Using ETFs in a Tough, Sideways-to-Bear Market
Tracking the S&P 500 With Mutual Funds and ETFs
How to Safely Navigate Through Crowded ETF Waters
The EZ Approach to ETF Portfolio Building
Nine Timeless Rules for Investing in Mutual Funds (and ETFs)
Visit the Fund websites listed in AAII’s “Best of the Web” that cover ETFs for more in-depth data, screening, news:
AAII InvestoGraphic
Exchange-Traded Funds
Mutual Funds

Rick from VA posted over 7 years ago:
Sue from FL posted over 7 years ago:
Jean from AAII posted over 7 years ago:
Lew from PA posted over 7 years ago:
Jean from AAII posted over 7 years ago:
Barry from CT posted over 7 years ago:
James F from TX posted over 7 years ago:
Dave from OH posted over 7 years ago:
Nick from NY posted over 7 years ago:
Roland from FL posted over 6 years ago:
ALEX B from CA posted over 6 years ago:
CHARLES R from IL posted over 6 years ago:
You need to log in as a registered AAII user before commenting.
Log InCreate an account