



Related

Portfolio Strategies
There can be a serious disconnect between investors and the indexes they reference—which can lead to a great deal of benchmarking confusion.

As found in the Merriam Webster dictionary, the term “benchmark” has the following definitions:
These definitions clearly suggest that a benchmark serves as a point of reference. The real key here—in the world of investments—is selecting a performance benchmark that is similar to the portfolio being measured against it. This often does not happen, which is why performance benchmarking can sometimes be sheer lunacy.
 For example, the performance of a diversified portfolio that contains stocks, bonds and diversifying asset classes (real estate, commodities, etc.) is often compared with the S&P 500 index—an index that only contains large-cap U.S. stocks. At first blush, this may seem reasonable inasmuch as the S&P 500 is a well-known index. Here’s the problem: The S&P 500 is not similar to a broadly diversified, multi-asset portfolio. Using the S&P 500 as the de facto performance benchmark for a wide variety of investment portfolios is analogous to comparing the taste of salsa to one of its ingredients, say tomatoes. Salsa contains tomatoes, but it also contains a variety of ingredients that make it—collectively—quite different than any of its individual ingredients.
Consider the following conversation:
“How do you like the salsa?”
“Oh, it’s great … but when I compare it against sliced tomatoes it tastes quite different.”
“Really? You’re kidding, right? Of course it tastes different than raw tomatoes. Why are you comparing salsa against tomatoes?”
“Well, I figured that since salsa contains tomatoes that would be a reasonable comparison.”
“Yikes! That’s crazy. Salsa should only be compared against another type of salsa.”
How does this relate to the performance comparison of different types of portfolios? Consider the following conversation:
“How do you like the diversified, multi-asset portfolio?”
“Oh, it’s great … but when I compare it against the S&P 500 it performs quite differently.”
“Really? You’re kidding, right? Of course it performs differently. Why are you comparing a diversified portfolio against one of its ingredients?”
“Well, I figured that since the portfolio contains large-cap U.S. stocks that would be a reasonable comparison.”
“Yikes! That’s crazy. A diversified portfolio should only be compared against another type of diversified portfolio.”
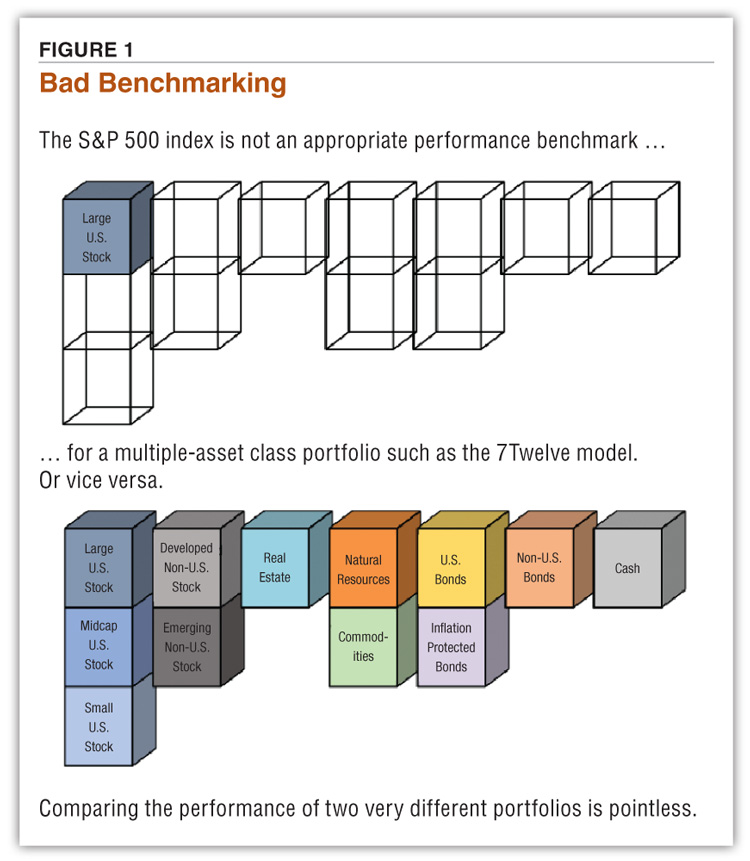
As shown in Figure 1, comparing a multi-asset portfolio against only one of its ingredients is not helpful, valid or even logical. The primary reason it’s often done is because of habit and because it’s easy to track the performance of an index that is publicized as broadly as the S&P 500. However, habit and ease are seldom the hallmarks of “best practice.”
So, what is the correct “point of reference” that could serve as an appropriate performance benchmark for various investment portfolios? There is not just one—there are many.
Permit me to suggest appropriate benchmarks for various investment portfolios (see Table 1). If your portfolio comprises primarily large-cap U.S. stocks (say, over 80% of your portfolio) then the S&P 500 is an appropriate benchmark. Conversely, if your portfolio is primarily a mixture of U.S. stocks and U.S. bonds, a likely benchmark would be the Vanguard Balanced Index fund (VBIAX).
However, if your portfolio comprises a broad selection of asset classes, including U.S. stocks, non-U.S. stocks, real estate, resources and commodities, U.S. bonds, non-U.S. bonds and cash, an appropriate performance benchmark is the 7Twelve Portfolio.
A multi-asset portfolio (think salsa here) should be compared against a multi-asset index. Enter the 7Twelve Portfolio, a portfolio model that incorporates 12 different asset classes in equal portions. The 12 asset classes are large-cap U.S. stock, mid-cap U.S. stocks, small-cap U.S. stocks, non-U.S. developed stock, emerging stock, real estate, natural resources, commodities, U.S. bonds, Treasury inflation-protected securities (TIPS), non-U.S. bonds and cash. (Full disclosure: I am the developer of the 7Twelve Portfolio.)
TABLE 1
Benchmarking Suggestions
Appropriate indexes for various types of portfolios.
There can be a serious disconnect between investors and the indexes they reference—which can lead to a great deal of benchmarking confusion. Actual investors have been (or should be) building diversified, multi-asset portfolios. The problem has been a lack of multi-asset, broadly diversified indexes to serve as appropriate performance benchmarks. My 7Twelve Portfolio can serve as an appropriate benchmark for a broadly diversified portfolio, and S&P Dow Jones Custom Indices now calculates the performance of the 7Twelve Index based on my portfolio. It is available at: www.customindices.spindices.com/indices/custom-indices/lunt-capital-7twelve-moderate-index.
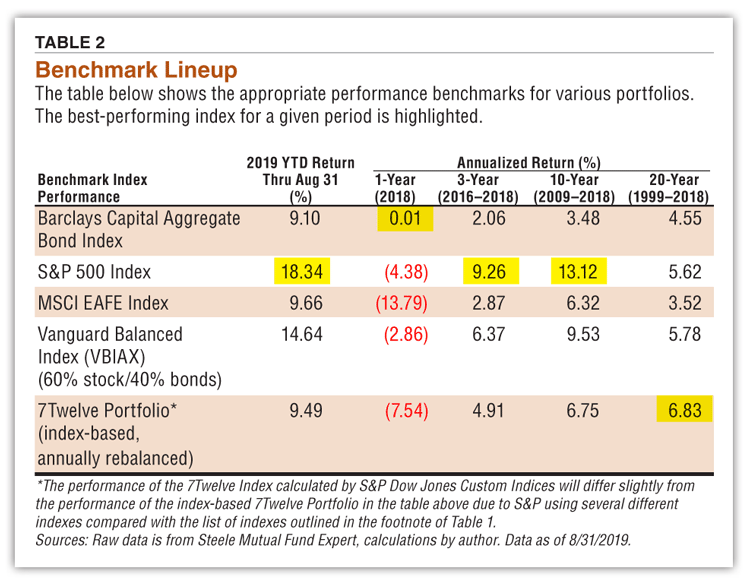
The annualized performance of several key benchmark indexes is shown in Table 2. As can be seen, the performance difference between “benchmarks” can be large—hence the importance of using the most appropriate one.
Consider the performance differential between U.S. bonds (as measured by the Barclays Capital U.S. Aggregate Bond Index) and U.S. large-cap stocks (S&P 500). For the three-year period of 2016–2018, the performance difference was sizable: 2.06% for bonds vs. 9.26% for stocks. However, over the past 20 years from January 1999 through December 2018, U.S. bonds actually came close to the performance of the S&P 500 (4.55% vs. 5.62%). The main point is simply this: bonds should not be used to benchmark stocks, or vice versa.
As you can see, the S&P 500 will often outperform a broadly diversified portfolio (the best-performing indexes are highlighted). The three- and 10-year returns of the S&P 500 are considerably higher than the 7Twelve Portfolio, for example. However, over the past 20 years we see the value of broad diversification. The index-based 7Twelve Portfolio produced an average annualized return of 6.83% vs. a 5.62% return for the S&P 500. However, those two are not the same thing—so they should not even be compared … remember!
Practically speaking, it’s fine to look at the performance of the S&P 500. It just shouldn’t be used as a performance benchmark for a portfolio that is broadly diversified across multiple equity and fixed-income asset classes.
All of this reminds us why the performance of the S&P 500 (or any other index that measures the performance of only one asset class) is an inappropriate performance benchmark for a portfolio that includes a variety of asset classes.
Portfolio Strategies

Value Investing

Computerized Investing

Richard from CA posted over 6 years ago:
Joe from TX posted over 6 years ago:
Barry C Johnson from Texas posted over 6 years ago:
Frederic Corwin from Florida posted over 6 years ago:
Gary Koenig from TX posted over 6 years ago:
WILLIAM B from PA posted over 5 years ago:
Sneha J from IND posted over 5 years ago:
You need to log in as a registered AAII user before commenting.
Log InCreate an account