




Benchmarks help inform investors as to the financial value they are receiving for the fees they pay. Are you earning less than the market? In other words, are you paying 1.0% or more in fees and getting less than market returns, while your neighbor is getting market returns and paying 0.1%, or 1/10th of what you pay in fees?
If you are an investor and do not use a benchmark to measure your portfolio, you are basically flying blind. Benchmarking returns give investors an idea of what returns they are getting in relation to the market. If you are personally managing your own money and are performing worse than the market while incurring more costs along the way, wouldn’t it make more sense to invest in an index mutual fund or exchange-traded fund (ETF) to capture market returns at less cost and not have to worry about trying to actively manage your money?
Even if you have a personal adviser who manages your money, it’s important to benchmark the adviser’s performance.
Steps in Choosing Your Benchmark
1. Determine the appropriate index weighting scheme.
Indexes and funds are typically equal-weighted, market-cap weighted, fundamentally weighted, or price-weighted. Choosing a benchmark that is weighted differently than your portfolio can have implications.
A company’s market capitalization is calculated by multiplying share price by the number of shares outstanding. In a market-cap-weighted index, the weight of a company in the index is equal to the market cap of that company divided by the total market capitalization of all the companies in the index. Therefore, companies with the largest market capitalizations dominate the overall index value, while smaller lower-market-cap firms contribute a small amount to the overall index value. A popular market-cap-weighted index is the S&P 500 index.
An equal-weighted index equally weights its holdings irrespective of market capitalization. If there are 500 holdings and the market value of all the holdings amounts to $1 million, each holding would have $2,000 invested in it ($1,000,000 ÷ 500), making up 0.2% of the total index value. Equally weighting an index gives the small-cap stocks the same weighting as the large-cap stocks.
Whereas the market-cap-weighted S&P 500 index does not need to be periodically rebalanced, its equal-weighted counterpart does. The S&P 500 equal-weighted index strives to maintain a portfolio of 500 equally weighted stocks over time. If it didn’t rebalance, better-performing stocks would compose a larger portion of the index, leading to distorted weightings over time.
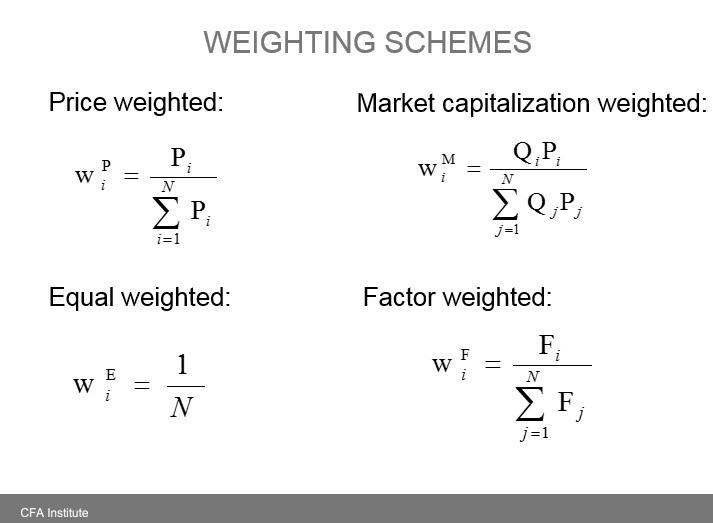
Another option is a fundamentally weighted index, where the holdings are weighted based on a particular fundamental metric such as price-earnings ratio, cash flow, revenue or dividends.
In a price-weighted index, the weight of each constituent is determined by dividing its price by the sum of all the prices of constituent securities. Price-weighted indexes are unique, in that when a stock splits it changes the weight on all the securities in the index. Because of this, the index provider must adjust the divisor (sum of constituent prices) to prevent the stock split from changing the value of the index.
Figure 1 shows the calculations for the various weighting schemes.
2. Choose a particular index or combinations of different indexes, ETFs or mutual funds.
Choosing an appropriate benchmark has to do with your specific portfolio holdings and how you manage them. If you are investing equal dollar amounts in stocks when you purchase and rebalancing when some positions outweigh the average position, an equal-weighted index is probably best for you.
You should also pay attention to market-cap bias that may exist in your portfolio. If you hold primarily large-cap stocks, use a large-cap index as a benchmark, such as the S&P 500. If you hold small-cap stocks, the Russell 2000 index may be a better choice for you.
You may also find that a specific mutual fund or ETF is a better comparison to your actual portfolio than a well-known benchmark index. If you choose this route, find a fund with a methodology similar to the one you use. Some investors find it helpful to choose specific benchmarks for every individual holding, and then an overall benchmark for the portfolio as a whole (but this is more time consuming, of course).
If you have several different asset classes within your portfolio, as many investors do, it’s important to either benchmark each asset class separately, or find a mutual fund or ETF that has holdings and weightings similar to your portfolio. If you are unsure of the asset allocation breakdown of your holdings, there are tools that aggregate that information; Personal Capital is one example. You can enter different investment accounts into Personal Capital and it will generate an asset allocation breakdown for you.
Some investors use target date funds to benchmark their investments because target date funds contain a mixture of different asset classes. Again, you have to analyze each particular target date fund to see if the portfolio composition is similar to your holdings.
I use the Wilshire 5000 equal-weighted index or the equal-weight Guggenheim S&P 500 Equal Weight ETF (RSP) as my stock benchmarks. I find these two benchmarks to be closest to how I invest.
Some popular benchmarks include:
- Dow Jones industrial average
- S&P 500
- S&P Equal Weight
- S&P MidCap 400
- S&P SmallCap 600
- Nasdaq Composite
- Russell 2000
- Wilshire 5000
- MSCI-EAFE
- S&P International 700
- S&P Asia 50
- S&P Europe 350
- S&P Latin America 40
- Barclays GNMA
- Barclays U.S. Aggregate Bond
- Barclays 1-3 Year Government
- Barclays Intermediate Government
- Barclays Long Government
- Treasury Bills
3. Monitor your benchmark online or with software.
To understand what your benchmark returned, you should make use of the free websites that provide current and historical data for many benchmarks. Below are some of the websites that offer data on benchmarks:
Lipper indexes are very useful for mutual fund investors, while international investors find the Morgan Stanley indexes (MSCI) helpful. If you choose to benchmark against specific sectors, the Select Sector SPDR ETFs are useful.
You also want to be sure to compare over the same time period. If you want to track the information yourself, a good idea may be to make note of your benchmark’s closing price on the day you buy a specific stock. That way, you are tracking your holdings’ performance in comparison to how the benchmark has performed over the same time period. One tool that allows you to do this is Computerized Investing’s Portfolio Tracker using Google Sheets. If you prefer a more visual representation, you can use Big Charts.
You can visit each particular benchmark’s website in order to get detailed information on rebalancing or weightings. For example, for information on the S&P 500 index, click here.
Another option is AAII’s asset allocation models, which show the respective returns for an aggressive investor, moderate investor or conservative investor. Each has different weightings between fixed income and diversified stock and the data is updated on a monthly basis.
Investors can also use tools such as AAII’s Guide to Mutual Funds, Guide to ETFs or Quarterly Mutual Fund Update to compare a particular fund’s return to its category average. Morningstar.com also provides this information on its website.
Portfolio Management Software
I suggest that you buy portfolio management software so you can track your stocks accurately in a professional manner. You will understand what your returns are and be able to have a productive conversation with your financial adviser. Computerized Investing recently did an excellent comparison of the top portfolio management software. Pick the one you feel comfortable with. Personally, I use Fund Manager, which was also featured in an article in Computerized Investing.
Once you own software, you will be able to track your returns like the brokerage houses. Return on investment (ROI), internal rate of return (IRR) or any other measure of return will be at your fingertips with the touch of your keyboard. As the CI software reviews highlight, you can separate your fixed income from your equities into sub-portfolios and measure their respective returns separately.
Measuring Investment Returns
There are a few rules to keep in mind when measuring investment returns. The first one is to measure stocks separately from bonds. Measure returns over long periods of time, such as five or 10 calendar years. I use calendar periods as opposed to market top/bottom as there is less opportunity for me to fool myself by picking date ranges that make my performance look better. Bond returns require their own article: Just remember that their returns are even more tied to risk than stock returns are; look at total returns instead of yields and only over five- or 10-year periods.
Measuring stock returns over five- or 10-year periods allows coverage over different market cycles. When the market is rewarding a different investment style, it is not the time to change your investment style; it is the time to be patient. If after analyzing your portfolio you see that your investments do not meet your needs, then that is the time to review and modify your holdings.
Understanding Your Investment Professional
Never hesitate to ask your investment professional just what an investment term means if you are unsure of the terminology. You should benchmark your portfolio to a market/index that has a similar risk profile. Risk and return are correlated, so your portfolio and the benchmark you use should have similar risk profiles. Standard deviation is part of many conversations about returns, or risk-adjusted returns. When your investment professional discusses standard deviation as a measure of risk, both the upside and downside are considered of equal importance. This makes mathematical sense, but most investors only care about volatility on the downside and welcome volatility on the upside.
Always check whether or not your benchmark includes dividends; you want to compare apples to apples when checking your portfolio’s return against your benchmark’s return.
When you run portfolio management software, you can feel secure that you are on track—or not—to meet your investment goals. When you depend on others, you do not have the same level of confidence that you are on track to meet your goals and may find yourself on the phone seeking assurance from others that your investments are okay.
After reviewing your portfolio and finding you are not making the returns you had hoped for, you may be able to increase your net returns without increasing your risk by looking to your expenses and trying to reduce the number of transactions or switch to lower expense ratio funds/ETFs.
If your portfolio is continually underperforming its benchmark, it may be time to make some changes. Find out which assets are causing your portfolio to lag its benchmark and then select securities that have historically outperformed their benchmark.
Discussion
FREE REPORT

Gregory Carr from NC posted over 9 years ago:
Bud from Nevada posted over 9 years ago:
You need to log in as a registered AAII user before commenting.
Log InCreate an account