

Related

Growth Investing
Among the 60 stock screening strategies AAII tracks, all but four posted gains over the last 10 years.

Wayne Thorp leads a class in AAII's new Essential Investing Video Course. Go to https://www.aaii.com/ves for more information and to subscribe.
By the time you read this, we will have embarked on a new decade, having closed the books on 2019. However, as I am writing this, we still have a few weeks to go in 2019. This year has reached two remarkable milestones. First, as of July 1 the U.S. economy entered into its longest period of expansion dating back to 1854—121 months since coming out of the financial crisis. We are now in month 126 and the economy continues to hum along. In November, the economy added 266,000 new jobs, handily beating the 187,000 expected by economists polled by Dow Jones. In addition, unemployment ticked downward from 3.6% to 3.5%, matching a 50-year low. However, according to The Conference Board, the U.S. Leading Economic Index declined for a third consecutive month in October and its six-month growth rate turned negative for the first time since May 2016. However, most forecasts point to moderate growth in the U.S. economy in 2020.
Second, we are also in the midst of the longest bull run in U.S. market history, according to The Leuthold Group. Since the close on March 9, 2009, through the close on November 30, 2019, the S&P 500 index has posted a total return (including dividends) of over 470%, making this the most successful post-war bull market as well.
Stocks are ending the decade on a high note. After turning in its only annual decline in 2018 (based on total return), the S&P 500 is up 27.6% on a total-return basis for the year through the end of November. For the decade, the large-cap index averaged better than a 13% annual gain.
Among the 60 stock screening strategies AAII tracks, all but four posted gains over the last 10 years (as of November 30, 2019). The median average annual 10-year return for all of the strategies AAII tracks is 10.2%, which is slightly below the annualized price gain for the S&P 500 over the last 10 years of 11.1%. Twenty-three of the 60 screening methodologies AAII tracks posted better price returns than the S&P 500 over the last 10 years.
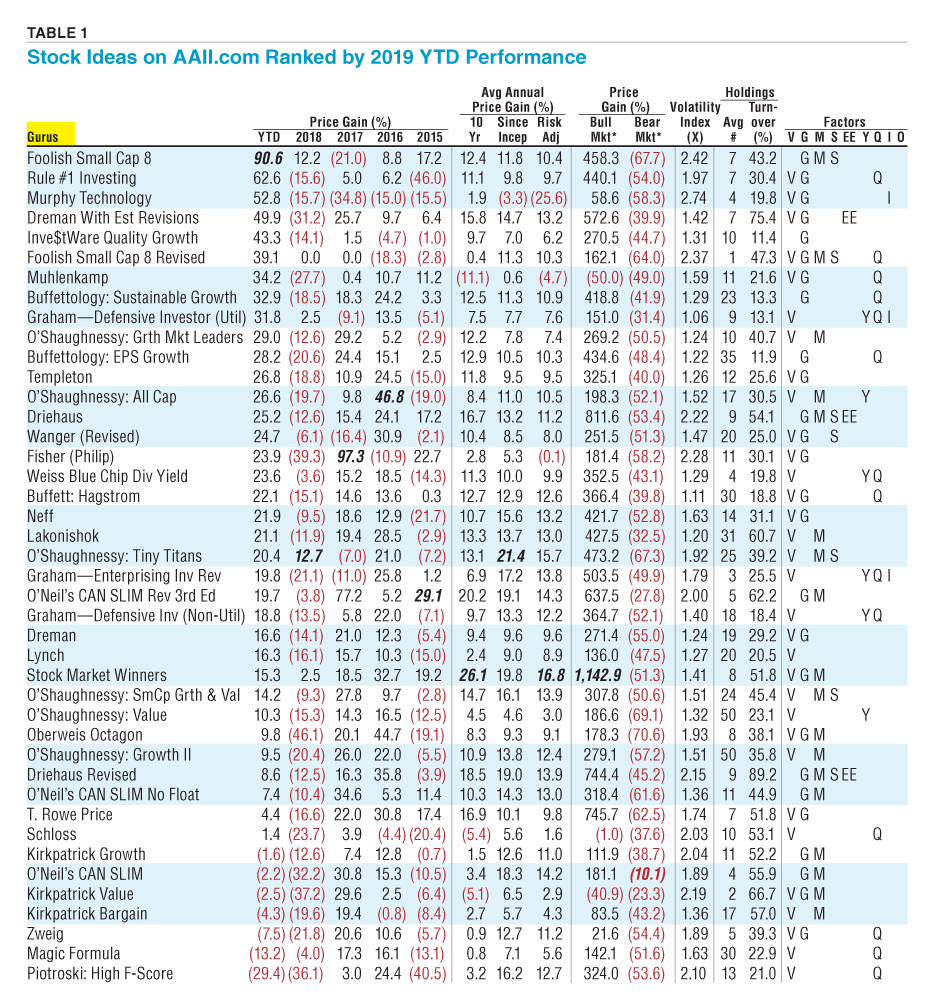
Table 1 summarizes the performance and variability of the factor and guru screening strategies AAII tracks, ranked in descending order by year-to-date price change through the close on November 30 (see the AAII Stock Ideas box for more information about them). All of the screening strategies that AAII tracks have been developed and backtested using Stock Investor Pro, AAII’s fundamental stock screening and research database program, and all but three—the Dogs of the Dow, Dogs of the Dow Low-Priced 5 and Magic Formula approaches—are built into the software. Table 1 also presents the price change performance (excluding dividends and transactions costs such as commissions, bid/ask spreads, time and price slippage, etc.) over various periods for each approach. The screening strategies are categorized based on the “factors” that underly each strategy. A key at the bottom of the table explains the initials; for a full description of the factor categories of AAII Screening Strategies, see the box at the end of this article.
 All but nine of the AAII screening strategies were up for the year through the end of November. Seventeen of the 60 AAII stock screening strategies outperformed the S&P 500’s price gain (excluding dividends) of 25.3%. [Editor’s note: We use the price gain for the index since the impact of dividends is not included in the performance of the AAII screening approaches.] The median price change of all AAII selection methodologies is 16.4%, compared to a median loss of 15.4% last year for the same set of screens. Looking at the 60 stock screens tracked at AAII.com, they too have generally had a good 2019. The Inve$tWare Quality Growth approach is experiencing its best year since 1998 with a gain of 43.3%.
For 2019 (through November 30), the top AAII guru strategy is Foolish Small Cap 8, which blends growth, momentum and size factors. This approach has seen a 90.6% gain through the first 11 months of the year.
The top AAII factor strategy for 2019 is the Estimate Revisions Up 5% strategy, which focuses on upward revisions to a company’s forecasted earnings.
This year, growth-oriented strategies did better at the large- and mid-cap levels, while value-oriented strategies outperformed growth among small-cap stocks. Through the end of November, the S&P 500 Growth index posted a total return—including dividends—of 27.4% while the S&P SmallCap 600 Growth index had a year-to-date total return of 17.6%. The continued strength of growth investing is also reflected in the return of the Nasdaq 100 index, which includes the 100 largest non-financial companies listed on the tech-laden Nasdaq Stock Market. For 2019, the Nasdaq 100 had a price gain of 32.8% through the end of November.
It is worth mentioning that all of the S&P style and market-capitalization indexes are market-cap weighted, which means the largest stocks in each of the indexes have a greater impact on the index’s overall performance. Indicative of the continued relative strength of larger stocks this year, the typical exchange-listed stock saw its shares fall by 4.8% through the end of November. As of November 30, 2019, the median market capitalization of all exchange-listed (non-OTC) companies in Stock Investor Pro was around $869.9 million (compared to $918 million as of November 30, 2018).

Download Table 1 Excel Spreadsheet.
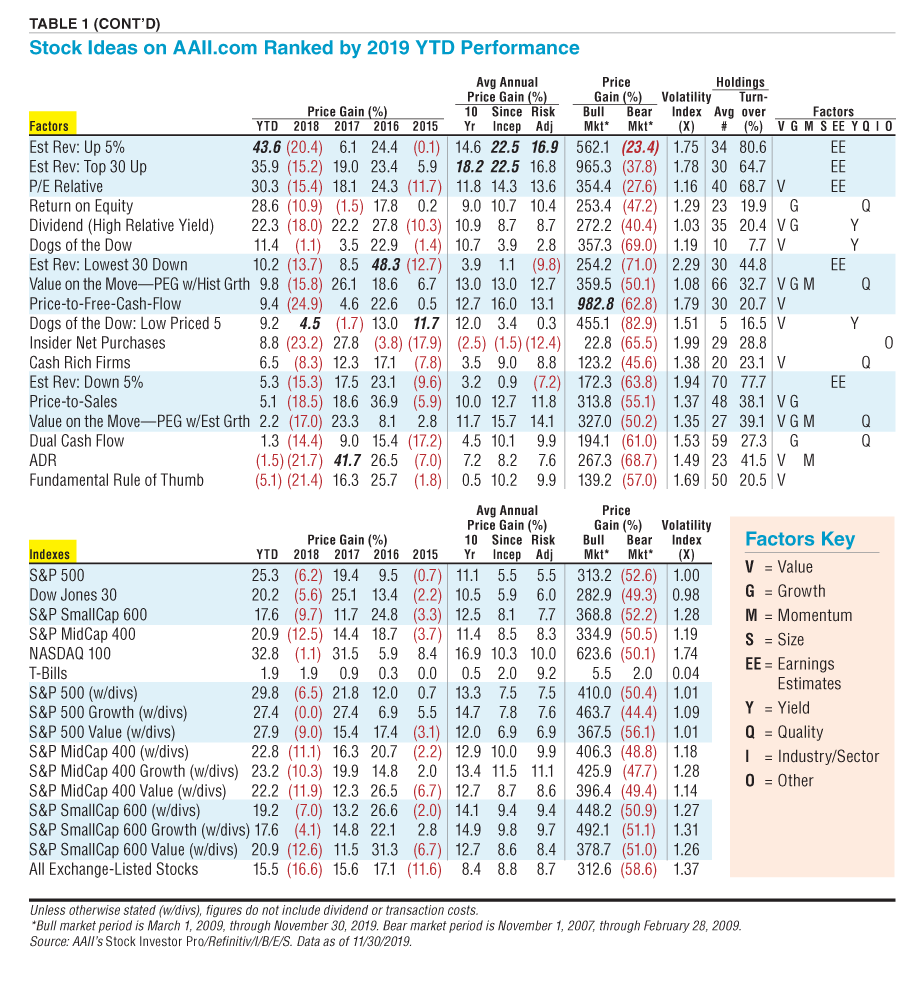
As stated, the top AAII factor strategy for 2019 is the Estimate Revisions Up 5%, which has generated a price return of 43.6% through the end of November. For many years, this approach has been at or near the top in terms of long-term performance, but this is the first year the strategy has risen to the top on an annual performance basis.
This strategy looks for stocks that have seen at least a 5% increase over the last month in their annual consensus earnings estimates for the current fiscal year and next fiscal year, while seeing no downward revisions.
The Foolish Small Cap 8 screen, as said, is the top AAII guru screen year to date, gaining 90.6% through the end of November. The methodology, developed by David Gardner and Tom Gardner of The Motley Fool, looks for profitable and rapidly growing small companies with strong price momentum. The Foolish Small Cap 8 screen is designed to flag potential growth companies as opposed to growth stocks. It is based upon a combination of four market-related factors and four business-related factors. The Foolish Small Cap 8 screen looks for companies with:
The Price Gain columns in Table 1 represent the percentage amount each hypothetical portfolio has gained or lost on an annualized and cumulative basis from January 1, 1998, through November 30, 2019.
Keep in mind, however, that these performance numbers do not include dividend payments or dividend reinvestments. Large-cap strategies, such as the Dogs of the Dow, are “penalized” the most by this type of dividend reinvestment exclusion.
The current average dividend yield of the 10 stocks passing the Dogs of the Dow screen is 3.6%; investors holding shares of these companies would actually have a higher return by approximately this amount annually.
Perhaps emblematic of the struggles value-oriented strategies have had over the last few years, the weakest overall AAII stock screening approach for 2019 is the Piotroski High F-Score screen. After ranking almost at the bottom for 2018 performance (down 36.1%), the Piotroski approach is down 29.4% through the end of November. Combining factors of quality and value, the Piotroski High F-Score strategy looks for stocks that rank in the bottom 20% of all U.S.-listed stocks in terms of price-to-book ratio that satisfy at least eight of nine elements:
While a lot of attention is paid to how well the markets and various indexes do on a year-to-year basis, most of us have a longer-term view of investing. As such, saying that a strategy is “good” or “bad” based on one year of performance isn’t practical or realistic.
Therefore, Table 1 also offers performance data over the last 10 years and since inception, which for most strategies spans the period from January 1, 1998, to November 30, 2019. Ten years is typically a long enough period to be meaningful and long enough to capture at least one full economic cycle.
The Estimate Revisions Top 30 Up screen is the top AAII factor strategy over the last 10 years with an average annual price gain of 18.2%. On the guru side of things (and overall), the Stock Market Winners approach jumped to the top of the list with an average annual price gain of 26.1% a year over the last 10 years.
Estimate Revisions Top 30 Up looks for stocks that have seen upward revisions over the last month to their annual consensus earnings estimates for the current fiscal year and next fiscal year, with no downward revisions. The strategy then tracks the 30 companies that have seen the largest percentage change in the current-year consensus estimate over the last month.
The Stock Market Winners strategy was developed by Marc Reinganum and stems from a publication by William O’Neil & Co. titled “The Greatest Stock Market Winners: 1970–1983.” Reinganum examined 222 stocks highlighted in the publication to establish the characteristics that were common to these stocks prior to their rise to prominence. Based on his analysis, Reinganum came up with nine trading rules to help identify potential future winners. These rules were:
Among the worst performers over the last 10 years, four strategies have negative average annual price gains, up from two at this time last year. Still at the bottom of the list is the Muhlenkamp strategy, with an average annual loss of 11.1% a year over the last 10 years. This approach looks for companies with above-average return on equity, a reasonable price-earnings ratio based on prevailing inflation and interest rates, positive long-term earnings growth, profit margins that exceed the industry norm, a ratio of liabilities to assets that is below the industry norm and positive free cash flow. Interestingly enough, however, the strategy ranked in the top 10 among all AAII’s screening approaches this year with a year-to-date price gain of 34.2%.
The other strategies with negative 10-year performance are Schloss (5.4% average annual loss), Kirkpatrick Value (5.1% average annual loss) and Insider Net Purchases (average annual loss of 2.5% a year over the last 10 years).
AAII has been developing, testing and refining a wide range of screening strategies over the years. Many of the screens follow the approaches of popular investment professionals, while others are tied to basic principles of investing. These approaches run the full spectrum, from those that are value-based to those that focus primarily on growth, while most fall somewhere in the middle.
Screens following the approach of an investment professional do not represent their actual stock picks. The rules of each screen are defined by our interpretations of their respective investment approaches. The results of the screening strategies, as well as the criteria for each screen, are programmed into the Stock Investor Pro program and are also posted on the Stocks pages of AAII.com.
Each month, 60 separate screens are performed using AAII’s Stock Investor Pro and the current companies passing each screen are reported. Stock Investor Pro subscribers can run the screens themselves on a daily basis, while AAII members can access the screening results by going to the Stocks page of AAII.com. The results are posted to AAII.com early each month (excluding holidays and weekends) using data from the previous month’s end. The AAII Stock Ideas Update email will notify you when the strategies have been updated on AAII.com and provide a more in-depth look at a featured screen each month. You can sign up for this complimentary newsletter at www.aaii.com/email.
The performance of the stocks passing each screen is tracked on a monthly basis. The month-to-month closing price is used to calculate the return, with equal investments in each stock at the beginning of each month assumed. The impact of factors such as commissions, bid/ask spreads, time slippage (the time between the initial decision to buy a stock and the actual purchase) and taxes is not considered. This overstates the reported performance, but all approaches are subject to the same conditions and procedures. Higher turnover portfolios typically benefit more from these simplified rules.
Keep in mind, however, that performance figures for the AAII stock screening strategies represent price change only, and do not include dividend payments or dividend reinvestment. Therefore, the results of screens that tend to isolate large, dividend-paying stocks—such as the Dogs of the Dow (in the value category)—do not receive a boost from dividend payments or reinvestment. The 10 stocks passing the Dogs of the Dow screen at the end of November were yielding 3.6%, compared to 3.1% at the end of November 2018; investors holding shares in these stocks, therefore, would have a higher annual return by approximately this amount for the coming year.
Sell rules are the same as the buy rules: The hypothetical portfolios are completely reallocated using each subsequent month’s data. Thus, a stock is sold (no longer included in the portfolio) if it ceases to meet the initial criteria, and new stocks are added if they qualify. Note that we use these rules for backtesting purposes but do not necessarily advocate them as part of a real-world investment framework.
Stocks that no longer qualify are dropped even if the strategist behind a particular approach suggests different sell rules versus buy rules. This may shorten the holding period and increase the turnover relative to what the strategist would suggest for an actual portfolio.
Table 1 also presents the risk-adjusted return for each of the strategies that AAII tracks. This calculation adjusts the performance of each approach using its volatility as measured through standard deviation of returns, penalizing screens with higher standard deviations (for a more detailed explanation of the risk-adjusted return calculation, see the box below). Using risk-adjusted returns since inception (1998), the three best-performing strategies continue to be this year’s top performer, Estimate Revisions Up 5% (+16.9%), Estimate Revisions Top 30 Up (+16.8%) and Stock Market Winners (+16.8%). The median risk-adjusted return for all 60 screening strategies AAII tracks is 10.1%.
Six of the AAII stock screening strategies have negative average annual risk-adjusted returns, up from five a year ago. On a risk-adjusted basis, we see that the Murphy Technology approach is once again at the bottom, with an average annual loss of 25.6%. This screening strategy looks for technology and telecommunications companies that have been growing sales by at least 15% a year over the last three years, as well as net margins and returns on equity (ROE) of at least 15%. Also, the Murphy Technology approach has a value filter based on the ratio of price to growth flow, which is a measure for identifying companies that are producing solid earnings and investing a large amount in research and development (R&D). This ratio compares the current share price to the amount of per-share earnings a company generates as well as the per-share R&D expense of the company.
Calculating Risk-Adjusted Return
The formula for calculating the risk-adjusted return is as follows:
Margin Rate + (Benchmark Std Dev ÷ Portfolio Std Dev) × (Portfolio Return – Margin Rate)
Where:
This calculation assumes that the portfolio return for a given stock screen is higher than the margin rate. If it isn’t, the risk-adjusted return calculation would be as follows:
Margin Rate + (Portfolio Std Dev ÷ Benchmark Std Dev) × (Portfolio Return – Margin Rate)
Following this methodology, we calculate the risk-adjusted returns since inception for all of the AAII stock screening strategies.
The volatility index compares the variability of returns, as measured by the standard deviation of return, for a given stock screening strategy to that of a benchmark. Standard deviation is a measure of return volatility computed using monthly returns since the beginning of 1998. The volatility index is the standard deviation of a strategy’s return divided by the standard deviation of return for a benchmark—in this case, the S&P 500. The volatility index provides a relative measure of risk by comparing the variation in return for a screen since the beginning of 1998 to the typical variation in return for the benchmark index. The volatility index of the S&P 500, therefore, is 1.00; methodologies with a volatility index below 1.00 are below average in risk.
None of AAII’s stock screening strategies has a volatility index below 1.0, which isn’t surprising. Stock selection strategies, after all, typically pass anywhere from a handful of stocks to around 50, while the S&P 500 is made up of 500 very heavily traded companies.
The AAII screening strategy with the lowest overall volatility index is the High Relative Dividend Yield factor screen. The passing company list for this screen is made up of “safer” dividend-paying stocks. Its volatility index value of 1.03 means the approach is 3% more volatile than the S&P 500 since the start of 1998. Therefore, the screen’s risk-adjusted return (nearly) matches its average annual return since the start of 1998 at 8.7%.
The High Relative Dividend Yield approach requires a rising dividend for each of the last six years, a current dividend yield that is greater than the seven-year average yield, reasonable payout ratios (depending on the industry), liabilities levels that are below industry norms and historical earnings growth that exceeds the industry norm.
The AAII stock screening strategy with the best average annual risk-adjusted return, Estimate Revisions Up 5%, has a volatility index of 1.75. This indicates that, since the beginning of 1998, the monthly variability of returns for the stocks held in this portfolio has been 75% higher than that of the S&P 500. Among all AAII stock screening strategies, the median volatility index value is 1.52, meaning that the typical stock screen tracked by AAII experiences 52% greater volatility in its returns than the S&P 500.
The Murphy Technology approach has the highest volatility index (2.74), indicating that the monthly variability of returns for the stocks held in this portfolio is nearly twice that of the S&P 500. Accordingly, its annualized loss of 3.3% since 1998 becomes an even more dismal risk-adjusted annualized loss of 25.6%.
The stock screening strategies are intended to be an educational resource to show what types of filters and strategies work over varying market conditions. They are not intended to be a buy or recommended list. At best you should view them as idea generators. You should analyze the passing stocks further before deciding whether to commit real dollars to them. Furthermore, since market conditions change, it is important to be adequately diversified.
One way to achieve sufficient diversification is to select stocks from multiple stock screening methodologies. However, it is not enough to simply choose those strategies that have the best long-term performance. Instead, it is useful to understand the forces influencing both the overall market and a strategy’s performance, and how changing economic conditions can impact both the market and individual stocks. Examining the characteristics of an investment methodology may reveal some practical problems you might face when trying to translate quantitative stock screening into real-world portfolio building.
Something else to keep in mind is that once you decide on which methodologies to follow, you cannot just let the quantitative screens choose your stocks. Screening is a multi-step process. For some investors, this means first applying quantitative filters such as the screens we have discussed here to help you arrive at a set of candidates that all share the same base set of characteristics. This does not necessarily mean they are all good investments. It is important then to perform at least cursory qualitative analysis to decide whether they are right for your stock portfolio.
Factor Categories of AAII Screening Strategies
The foundation of value investing is the notion that cheaply priced stocks outperform more expensive stocks in the long term. Value has several dimensions: the stock price as a multiple of company earnings, price as a multiple of book value and other such ratios. Comparing a company’s price-earnings (P/E) ratio to its forecasted or historical earnings growth is also used (PEG ratios). Academics and investors differ on which measure best represents a value company. The value factor has a long history in financial research starting in the 1930s when academics developed a methodology for identifying stocks trading less than their actual value. However, the best-known work on the value factor was carried out by Eugene Fama and Kenneth French in their 1992 paper, “The Cross-Section of Expected Stock Returns,” which concluded that a low price-to-book ratio was the most predictive definition of value.
Screening strategies are tagged as “value” if they contain filters that look for stocks with low price multiples on either an absolute or relative basis; have price multiples that are low based on historical averages or sector/industry norms; or have price multiples that compare favorably to either historical or forecasted growth (PEG).
The foundation of growth investing is the notion that stocks of companies exhibiting strong, consistent and prolonged growth outperform those of slower-growth companies. Growth has several dimensions, including year-over-year increases in sales and earnings, long(er)-term historical sales and earnings growth rates and analyst-forecasted long-term earnings growth.
Stock screening methodologies are tagged as “growth” if they look for stocks with a history of earnings increases; look for minimum levels of growth in sales, earnings, cash flow, etc.; or have minimum projected earnings growth.
The momentum factor refers to the tendency of winning stocks to continue performing well in the near term (three to 12 months). Academics first identified the momentum premium in 1993, when Narasimhan Jegadeesh and Sheridan Titman demonstrated that the strategy of buying stocks that have done well and selling stocks that have done poorly generated significant positive returns over three- to 12-month holding periods.
Stock screening strategies are tagged as “momentum” if they look for minimum levels of absolute or relative price strength or require the share price to be within a certain percentage of the 52-week high.
The size factor captures the tendency of small-cap stocks to outperform bigger companies over the long run. The market capitalization of a company is its current share price multiplied by the number of outstanding shares. University of Chicago Ph.D. Rolf Banz identified the size factor in U.S. stocks in 1981. The research on size took off after economists Eugene Fama and Kenneth French included it as a key component in their influential three-factor model.
Stock screening approaches are tagged as “size” if they look for smaller companies, typically with market capitalizations below $2 billion, or relatively small levels of annual sales.
Investing based on analyst estimates looks for revisions in the consensus estimates as well as earnings surprises (actual earnings deviating from the consensus estimate). Academic studies have shown that companies that have seen strong upward earnings revisions or have reported significant earnings surprises can see an impact on share prices for up to a year.
Screening strategies are tagged as “earnings estimates” if they filter for the number of upward or downward revisions by analysts; the percentage change in the consensus estimate; and the percentage by which reported earnings exceeds or falls short of the consensus estimate (percentage surprise).
A yield (or high dividend yield) investment strategy gains exposure to companies that appear undervalued and have demonstrated safe, stable and increasing dividends. Dividend investing is as old as stocks themselves, playing a central role in the evolution of corporations over the centuries. Groundbreaking economists Benjamin Graham and David Dodd famously called dividend payouts “the prime purpose of a business corporation … A successful company is one that can pay dividends regularly and presumably increase the rate as time goes on.”
Screening strategies are tagged as “yield” if they specifically look for dividend-paying stocks as well as minimum absolute dividend yields or stocks that are trading with yields above historical averages or sector/industry norms.
The quality factor is described in academic literature as capturing companies with durable business models and sustainable competitive advantages. This definition has been expanded to look at company profitability and growth and quality of management. The quality factor has helped explain the movement of stocks that have low leverage, stable earnings and high profitability.
Screening methodologies that are tagged “quality” look for companies with records of consistent sales or earnings growth; strong returns on equity on either an absolute basis or relative to historical averages or sector/industry norms; and reasonable levels of debt.
Sector and industry rotation is an investment strategy involving the movement of money from one industry or sector to another in an attempt to beat the market.
Screening strategies tagged as “industry/sector” explicitly isolate specific sectors or industries.
The miscellaneous category captures specialty screening strategies that do not fall into one of the other factor categories.
Growth Investing

Portfolio Strategies

Investor Professor

Arun from Michigan posted over 6 years ago:
Doug from Washington posted over 6 years ago:
Charles from WA - Washington posted over 6 years ago:
Charles from WA - Washington posted over 6 years ago:
Doug from Washington posted over 6 years ago:
Joe L from Pennsylvania posted over 6 years ago:
David Williams from WA posted over 6 years ago:
Stephen S from FL posted over 6 years ago:
Wayne A. Thorp, CFA from IL posted over 6 years ago:
John N from Michigan posted over 6 years ago:
James M McEntyre from Florida posted over 6 years ago:
john deam from California posted over 6 years ago:
Wayne A. Thorp from IL posted over 6 years ago:
Jim L from Michigan posted over 6 years ago:
Allan from Georgia posted over 6 years ago:
John from Iowa posted over 6 years ago:
Greg from Florida posted over 6 years ago:
You need to log in as a registered AAII user before commenting.
Log InCreate an account