


Related

Investor Professor
Faber’s shareholder yield approach has the potential benefit of investing in classic value companies that are also buying back their stock and reducing their debt.

Derek Hageman leads a class in AAII's new Essential Investing Video Course. Go to https://www.aaii.com/ves for more information and to subscribe.
There are essentially five choices companies have for deploying capital: invest in existing operations, pursue mergers and acquisitions, pay down debt, repurchase shares and, importantly, initiate or increase dividend payments.
In a research paper by Michael Mauboussin, “Share Repurchase from All Angles,” he states: “The purpose of a company is to maximize long-term value. As such, the prime responsibility of a management team is to invest financial, physical and human capital at a rate in excess of the opportunity cost of capital. Operationally, this means identifying and executing strategies that deliver excess returns. Outstanding executives assess the attractiveness of various alternatives and deploy capital to where its value is highest.” To beat the street, investors could do worse than using shareholder yield as a value measure. In this article, we introduce the shareholder yield strategy of Mebane (Meb) Faber.
Faber is a co-founder and the chief investment officer of Cambria Investment Management. Faber is the manager of Cambria’s exchange-traded funds (ETFs) and separate accounts. His research has covered a wide range of investment strategies and topics, including shareholder yield, global valuations, global asset allocation, endowment investing, venture capital and angel investing, behavioral finance and trend and momentum following. He has also written several books.
Based on information gleaned from Faber’s book “Shareholder Yield” (The Idea Farm, 2013), AAII is developing a screening strategy that attempts to capture the spirit of Faber’s shareholder yield investing focus. This strategy looks for companies that are focused on creating value for shareholders by putting them first. The approach seeks companies that pay dividends, repurchase shares and pay down debt. Together, the summation of these three variables is what Faber calls shareholder yield. It measures a firm’s commitment to shareholder-friendly practices. [Note: The definition of shareholder yield that AAII uses in the Value Grade for stocks is the percentage change in shares outstanding (buyback yield) plus the dividend yield.]
Faber’s shareholder yield strategy helps investors find returns in a low-yield environment. Investors have looked to dividend-paying stocks in search of yield; however, according to Faber, fewer companies are paying dividends due to legal, tax and structural changes in the U.S. markets. Dividend payments are only one use of a company’s free cash flow. Other uses of cash include: share repurchases, debt paydown, reinvestment in the business and mergers and acquisitions.
Consequently, Faber writes that investors in the 21st century must look to all of the direct and indirect ways in which companies distribute their cash to shareholders, a metric he refers to as shareholder yield. In his book, Faber analyzes portfolios based on various cash flow metrics and finds that portfolios of companies with high shareholder yields outperform both broad market indexes and high dividend yield portfolios by a substantial margin. With all of the uncertainty in the markets today, Faber believes that shareholder yield helps investors answer one of the most often asked questions in investing today, “Where do I find yield?”
Faber notes that positive free cash flow has long been emphasized by investors as a key predictor of a company’s strength. Companies that pay cash dividends, one indication of strong free cash flow, have historically outperformed the broader market. However, focusing strictly on dividend payments misses two key indicators of strong free cash flow: net share repurchases and net debt paydown. Faber believes that a focus on all three factors helps identify companies that offer strong free cash flow characteristics.
Faber’s shareholder yield strategy forms the basis for an ETF of the same name, the Cambria Shareholder Yield ETF  (SYLD). The following points provide the philosophy underlying the fund:
Faber acknowledges that most financial writing owes a major debt of gratitude to the research that has come before it. He says that there have been many analysts and researchers who have examined the effects of selecting stocks based on various measures of cash flows and their distributions. He further acknowledges building on the research of James O’Shaughnessy and Mauboussin, among others, to develop the shareholder yield approach.
AAII’s shareholder yield strategy employs our interpretation of Faber’s quantitative algorithm to select U.S.-listed companies that show strong characteristics in returning free cash flow to their shareholders. Specifically, the approach seeks companies with market capitalizations greater than $200 million that rank among the highest in paying cash dividends, engaging in net share repurchases and paying down debt on their balance sheets.
Shareholder Yield = Dividend Yield + Buyback Yield + Debt Paydown Yield
Dividend Yield = Indicated Annual Dividend ÷ Price per Share
Buyback Yield = Shares Outstanding for Current Fiscal Period ÷ Shares Outstanding for Prior Fiscal Period
Net Payout Yield = Dividend Yield + Buyback Yield
Debt Paydown Yield = Total Debt Outstanding for Current Fiscal Period ÷ Total Debt Outstanding for Prior Fiscal Period
Notes:
• Indicated annual dividend = most recent quarterly dividend (SYLD) 4.
• Positive buyback yield represents a decline in number of shares outstanding; negative buyback yield represents an increase in number of shares outstanding.
• Higher net paydown yields imply more attractive valuations.
Dividends are cash distributions that many companies pay out regularly to shareholders from earnings. It is a way for companies to reward investors and to share their profits. Dividends and their reinvestments have historically provided higher cumulative returns with lower levels of volatility versus non-dividend-paying stocks over long-term holding periods. An examination of equity returns looking back to 1871 in the U.S. illustrates this point. An investor in U.S. stocks would have realized an 8.8% compound return from 1871 to 2011. However, excluding dividends and their reinvestments would have reduced the portfolio’s compound return to 4.1% per year, demonstrating that reinvested dividends represent over half of an investor’s annualized returns over the period.
Faber states that while it is evident that dividends contribute a major portion of returns to an entire stock market over time, research also indicates that higher dividend yielding stocks have performed better than stocks with little to no yield. The dividend yield is calculated by dividing the indicated annual dividend by the current stock price. The indicated annual dividend is the anticipated cash dividend payment over the next year. It is the percentage rate of return paid on a stock in dividends. A high dividend yield indicates a low price compared to the stock’s indicated dividend, meaning investors pay less per dollar of dividend.
Companies with meaningful dividend yields and growing dividends often represent undervalued investment opportunities, with the added benefit that the dividend yield often serves as some protection against price declines.
There is sufficient evidence that shares of companies that aggressively buy back shares have better returns. According to academic studies, stocks with high buyback yields outperform stocks with low buyback yields. Share buybacks are one mechanism that companies use to return excess cash to shareholders. When a company reduces the number of outstanding shares, remaining shares gain a slightly larger proportional claim to the company and its profits. This allows earnings per share to expand more quickly than net income. The theory is that a share buyback is a signal to the market that management thinks the stock is undervalued, and the company is repurchasing shares at a discount.
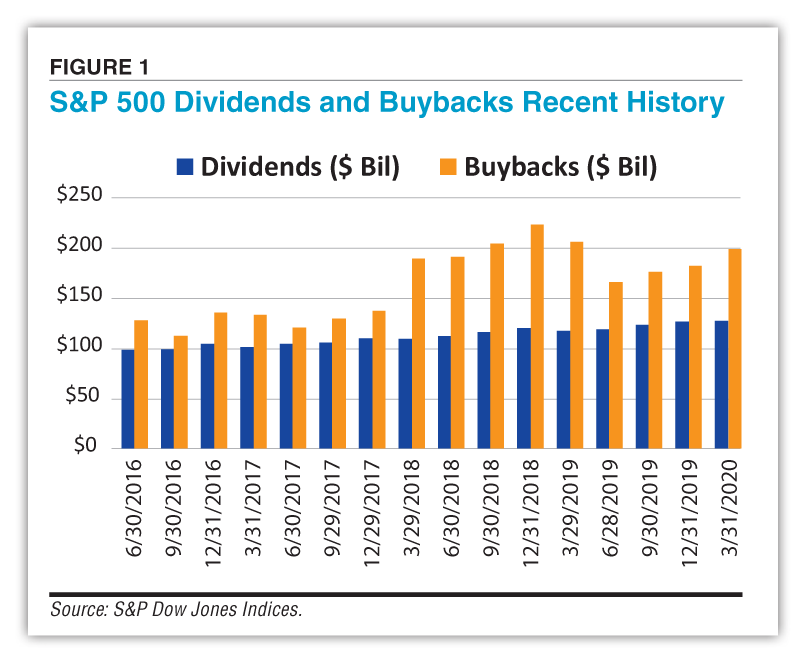
Corporate share repurchases have boosted U.S. stock returns in recent years. Buybacks among S&P 500 companies peaked above $200 billion per quarter during the second half of 2018 and during the first quarter of 2020 according to data from S&P Dow Jones Indices (Figure 1). Though most companies had yet to report second-quarter 2020 earnings as of the time of publication, CNBC says more than one-third of S&P 500 members suspended buybacks in response to the coronavirus pandemic, citing a report from Informa Financial Intelligence. Buybacks have also come under fire recently from politicians who would rather see companies reinvest excess cash flow to retain employees.
Despite plans to slowly reopen the economy, there is intense pressure for companies to preserve cash amid the uncertainty. Some companies have suspended their share repurchasing programs for the time being, while others have had to cut or eliminate their dividend.
When a company repurchases shares, it buys back its shares trading in the open market, or it offers shareholders the option of tendering their shares directly to the company at a fixed price. Since share repurchases reduce the number of shares outstanding, it increases earnings, cash flow and equity attributable to each of the remaining shares and elevates the market value of the remaining shares (all else equal). While there are a couple of ways to calculate the buyback yield, the easiest is to look at the change in the number of outstanding shares. A stock’s buyback yield is determined by comparing the average shares outstanding for one fiscal period against the average shares outstanding for another fiscal period.
A reduction in the number of shares is the buyback yield. Note that the signs are reversed, so a positive buyback yield indicates that the average number of shares outstanding declined while a negative number indicates that the average number of shares outstanding is increasing.
A stock’s net payout yield is the sum of its dividend yield and buyback yield and shows what percentage of total cash the company is paying out to shareholders, either in the form of a cash dividend or as cash used to repurchase its shares. Thus, if a company is paying a 5% dividend yield and has a buyback yield of 10%, its net payout yield would be 15%. The theory is that stocks with higher net payout yields might be more attractive than those with lower ones.
Unlike other valuation measures, net payout yield is inversely related with value, with higher net payout yields implying more attractive valuations. Because the buyback yield is the change in the number of shares outstanding, the net payout yield can be either positive or negative. A negative net payout yield would occur when the percentage increase in the number of shares outstanding exceeds the dividend yield. If no dividend is paid, net payout yield will be negative if the number of outstanding shares increases.
Faber cites O’Shaughnessy’s detailed analysis of investment strategies from the fourth edition of his book “What Works on Wall Street” (McGraw-Hill, 2011). O’Shaughnessy’s examination of stocks with the highest net payout yield (top 10%) showed an average annual compound rate of return of 13.2% from December 31, 1926, to the end of 2009, compared to a gain of 10.5% for the overall universe. The variability of return was also lower than that of the overall average, pushing the risk-adjusted return even higher for this group. Portfolios made up of stocks with the lowest net payout yield had a compound annual return of just 6.1%, coupled with higher risk.
The third component of shareholder yield is the debt paydown yield. There are a couple ways to calculate it, but the easiest is to look at the change in the short- and long-term borrowing and debt. A stock’s debt paydown yield is determined by comparing the total value of debt outstanding for one fiscal period against the total value of debt outstanding for another fiscal period. Paying down debt is a somewhat more unfamiliar method of improving shareholder value. Reducing the net amount of debt on a company’s books not only reduces interest costs, but also increases shareholder claims on future cash flows.
Faber states that the most holistic way to approach the topic of yield investing is to seek companies that pay dividends, repurchase shares and pay down debt. Together, he calls the summation of these three variables the shareholder yield strategy and it measures a firm’s commitment to shareholder-friendly practices.
This article introduces Faber’s shareholder yield approach. In next month’s AAII Journal, we will unveil a screening strategy that attempts to capture the spirit of Faber’s shareholder yield focus. Quantitative screens will be employed to arrive at an optimal shareholder yield profile.
The filtering process begins with a broad universe of stocks with a market cap of over $200 million that pass certain liquidity and price requirements. The universe will include only exchange-listed, dividend-paying stocks. Screening for firms in the top percentile of the universe by yield across dividends and buybacks represents a reasonable strategy for tracking down high shareholder yield companies. We will then use valuation factors such as price to cash flow, price to book value and price to earnings to screen for stocks trading at attractive relative valuations. Other outlier stocks will also be excluded based on quality and leverage characteristics.
Requiring low financial leverage further will filter the top shareholder yield stocks. Finally, as a measure to avoid value traps, we will examine momentum and trend indicators to position the Faber approach to identify the strongest shareholder yield stocks. ?
Investor Professor

Portfolio Strategies
Stock Strategies

M E from NJ posted over 6 years ago:
EDWIN H from VA posted over 6 years ago:
DAVE G from WA posted over 6 years ago:
DAVE G from WA posted over 6 years ago:
Francis S from TX posted over 6 years ago:
You need to log in as a registered AAII user before commenting.
Log InCreate an account