



Related

First Cut Stocks
The payout ratio helps an investor determine if earnings are sufficient enough to cover the dividend payment.

Derek Hageman leads a class in AAII's new Essential Investing Video Course. Go to https://www.aaii.com/ves for more information and to subscribe.
There is little point in seeking out dividend-paying stocks unless the dividend is secure and expected to grow. Many companies pay dividends, but those that can sustain their dividend payments are more desirable. Dividends tend to be “sticky.” Once a dividend payment is established, companies are under pressure to maintain and increase the payment. A company’s stock price will likely be punished in the event of a dividend decrease or suspension.
According to the Janus Henderson Global Dividend Index (JHGDI) study into global dividend trends published in February 2021, companies in the U.S. pay just over two fifths of the world’s dividends. In the U.S., dividend payouts rose 2.6% to a record $503.1 billion in 2020, with only 7% of the companies cutting or canceling dividends. In many cases, share buybacks were curtailed ahead of dividends. There are 335 U.S. companies in the index, and more than 90% increased their dividends or kept them in line with previous declarations. Of the companies that cut or canceled their payouts, the biggest impact came from banks, energy, mining and consumer discretionary companies.
There are many measures investors use to help assess the safety and sustainability of the dividend, but the earnings payout ratio (or simply the payout ratio) is perhaps the most common calculation. The payout ratio is calculated by dividing annual dividends per share by annual earnings per share.
The payout ratio illustrates the percentage of earnings paid out to shareholders in dividend payments, usually shown as the percentage of a firm’s earnings. The earnings payout ratio provides a glimpse into a company’s financial health. The payout ratio helps an investor determine if earnings are sufficient enough to cover the dividend payment.
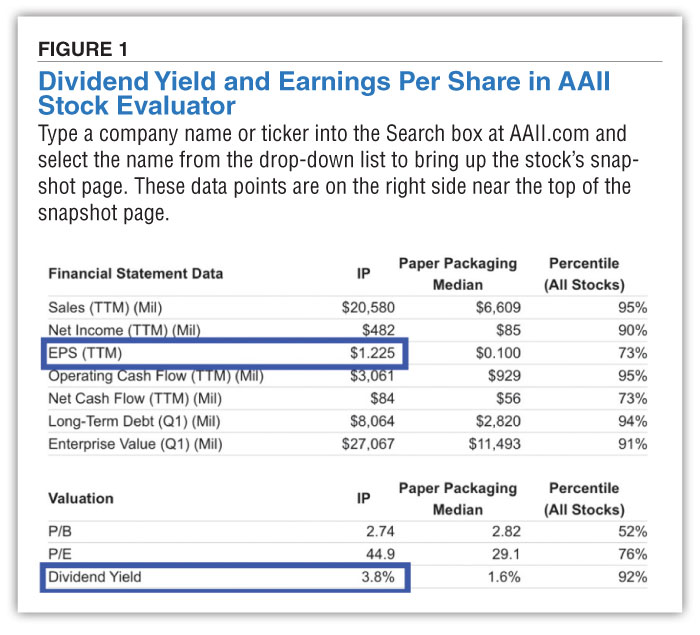
AAII members can find the information necessary to calculate the payout ratio in the Stock Evaluator. To access it, simply type a company’s name or ticker symbol into the search box located at the top of any page on AAII.com, and then select the name from the drop-down list that appears. On the right side of the evaluator’s snapshot page, you will find two key metrics (Figure 1). The first is the dividend yield, located with the Valuation data. Multiplying this by the stock’s price (shown at the top of the snapshot page) will give you the indicated dividend. You can then divide the indicated dividend by earnings per share—EPS (TTM), located with the Financial Statement Data—to determine the payout ratio.
Companies that do not pay a dividend have a payout ratio of zero and retain all their earnings. Many growth companies do not pay dividends because they prefer to reinvest their earnings into more promising opportunities. A firm that pays out half of its earnings to shareholders with a dividend has a payout ratio of 50%, while a company with a dividend equal to earnings has a payout ratio of 100%.
A company’s payout ratio can be compared to sector and industry medians as well as against its own historical average. Companies in defensive sectors, like utilities, tend to have stable and predictable earnings and cash flows, allowing them to support higher payout ratios than cyclical companies, whose earnings may significantly fluctuate quarter to quarter. There is often no “hard rule” for the earnings payout ratio; it is merely a calculation that can be used as a tool to determine the safety of the dividend payment.
A payout ratio over 100% is generally regarded as unsustainable since a company can’t pay out more than 100% of its profit through dividends in the long term. Generally speaking, a payout ratio below the historical average is more attractive because it illustrates that the company has grown earnings faster than dividend payments and potentially has room to grow its dividend.
Determining the proper amount of dividend payments means establishing a target for company payout ratios, and then using those ratios as a reliable, long-term target for figuring out what companies can pay in dividends over the long haul. One of the goals of dividend-paying companies is to establish a regular record of making quarterly dividend payments every year, over a period of years, preferably with no break or gaps in making dividend payments. That’s where payout ratios can really help a company establish a regular and reliable pattern of dividend payments to shareholders.
There has been a trend recently of companies providing their target free-cash-flow payout ratio (annual dividends per share divided by annual free cash flow per share) rather than their earnings payout ratio. For example, Texas Instruments  (TXN), one of the world’s largest semiconductor manufacturers, provides a target free-cash-flow payout ratio between 40% and 60%, while International Paper Co. (IP), a leading worldwide producer and distributor of packaging products, targets 40% to 50%. It is useful to evaluate both the earnings payout ratio and the free-cash-flow payout ratio when analyzing dividend-paying stocks.
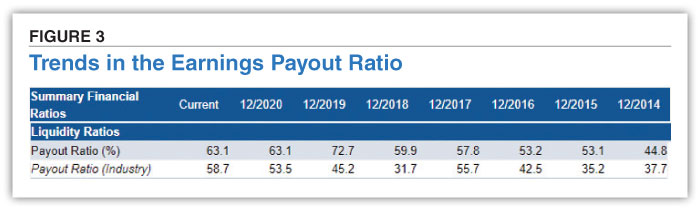
To illustrate how the payout ratio can be used for analyzing a stock, 3M Co. (MMM) is used as an example. We look at data from the Financials tab (Figure 2) and the Ratios tab (Figure 3) of the Stock Evaluator; both of these tabs are accessible to A+ Investor subscribers.
3M paid out $5.88 per share in dividends over the last 12 months on earnings per share of $9.32, resulting in a payout ratio of 63.1% ($5.88 ÷ $9.32 = 63.1%). Another way to think about the ratio is that 3M paid out 63.1% of earnings in the form of dividends. 3M’s earnings payout ratio has ranged between 44.8% and 72.7% over the last seven years, while the consumer goods conglomerates industry median has fluctuated between 31.7% and 58.7%.
3M’s current earnings payout ratio of 63.1% is coming off a multi-year high of 72.7% ($5.76 ÷ $7.92 = 72.7%) in 2019 as 3M’s earnings per share improved from $7.92 to $9.32. Since payout ratios use earnings per share in the calculation, they can be volatile due to temporary earnings fluctuations.
To illustrate the impact of earnings fluctuations, imagine if 3M’s dividend is maintained next year at $5.88 per share and its earnings per share increase 10.0% from $9.32 to $10.25. If this were to occur, the earnings payout ratio would drop to 57.4%—in line with its seven-year earnings payout ratio average of 57.8%. However, if 3M’s dividend is maintained again at $5.88 per share next year, but its earnings per share decrease by 10.0% from $9.32 to $8.39, the payout ratio will jump to 70.1%.
Firms cannot afford to pay out more than they earn in the long run without destroying liquidity and long-term growth opportunities. Consider International Paper, for instance. The company earned $1.23 per share over the last 12 months but paid out $2.05 per share in dividends. This equates to a payout ratio of 167.3% ($2.05 ÷ $1.23). Such a high payout ratio is unsustainable.
Looking at the factors influencing a company’s profitability can provide useful context by which to judge the payout ratio. In the case of International Paper, its earnings were adversely impacted by the coronavirus pandemic. As of February 2021, conditions are starting to slowly improve for the company, but earnings have been negatively impacted by lower prices across most regions in very challenging supply and demand conditions.
Looking forward, analysts expect International Paper to earn $3.83 per share this year (as is stated on the snapshot page available to all AAII members), a 211.4% improvement over 2020. International Paper has an indicated annual dividend of $2.05 per share leading to an expected 53.5% payout ratio for 2021. The company’s payout ratio is expected to improve over time as earnings increase. If not, the sustainability of its dividend would be put into jeopardy.
In our illustration, we only used the earnings payout ratio, but it is usually combined with other measures such as the free-cash-flow payout ratio and the current ratio (current assets divided by current liabilities) to get a more complete understanding of a company’s liquidity situation. Many factors go into determining these ratios and a deeper dive into a company’s financial statements is often suggested to ascertain a company’s total financial health.
First Cut Stocks

Investor Professor

HARRY C from CA posted over 5 years ago:
VAIDY B from CAN posted over 5 years ago:
You need to log in as a registered AAII user before commenting.
Log InCreate an account