

Related

The Big Question
Revisiting the characteristics of a unique screening strategy to help young investors beat the market.
by Derek J. Hageman | May 2021

Derek Hageman leads a class in AAII's new Essential Investing Video Course. Go to https://www.aaii.com/ves for more information and to subscribe.
The millennial generation born from 1980 to about 2000 may not be able to count on pensions and Social Security in retirement as much as older generations did. The country is aging while at the same time taking on more debt. Additionally, the legislative will to fix Social Security has yet to be shown. Millennials may have to be more financially self-sufficient than their parents. Millennial investors should not despair because one of youth’s greatest advantages is the chance to build a fortune by making early investments in the stock market. Young money—even in modest amounts—has significant potential.
In his book, “Millennial Money: How Young Investors Can Build a Fortune” (Palgrave Macmillan, 2014), portfolio manager Patrick O’Shaughnessy introduces the unique opportunities available to millennial investors and provides a clear plan for building wealth over a lifetime. The book encourages millennial investors to invest in the global stock market for wealth accumulation and provides reasons why they should invest, strategies they can follow and behavioral traps they will encounter and how to avoid them.
With an investment strategy that focuses on three key lessons, O’Shaughnessy writes that young investors can beat the market if they learn to:
Patrick O’Shaughnessy is a millennial himself and a principal and CEO at O’Shaughnessy Asset Management (OSAM). He oversees the day-to-day business of the firm, directing OSAM’s initiatives in the areas of research and portfolio management, investor education and investor relationships.
The main reason O’Shaughnessy wrote “Millennial Money” was to highlight the unique chance for the largest generation in history to succeed where past generations have failed. O’Shaughnessy suggests that millennial investors should invest as high of a percentage of their income as possible “in the global stock market rather than in ‘low-risk’ alternatives like cash or bonds.” O’Shaughnessy also notes that “successful investing is often contrarian and counterintuitive.”
In this article, we revisit the characteristics developed by O’Shaughnessy that capture his investment strategy for millennial investors, with an emphasis on building a unique portfolio using AAII’s Stock Investor Pro fundamental stock screening and research database program.
O’Shaughnessy gives a summary of his approach in the November 2014 AAII Journal article, “A Strategy Millennial Investors Can Use to Beat the Market.” To beat the market, O’Shaughnessy said one thing in particular is important: “You must build a portfolio that is very different from the overall market.”
O’Shaughnessy offers strategies that can serve as an investing framework and gives five traits that millennial investors should look for in a stock. Those traits are:
O’Shaughnessy comments that the five factors measure very different attributes of a company’s internal success (return on capital), accounting choices (earnings quality) and policies (shareholder orientation). They also measure market sentiment (value and momentum).
Using these factors in combination can lead millennial (and younger) investors to identify companies that are solid operating businesses for which the market has lower (value) but growing (momentum) expectations. This has been a good combination across market history.
O’Shaughnessy believes that owning stocks with these characteristics will lead to a portfolio that is both unique and performs well over time.
O’Shaughnessy writes that if millennial investors take only one lesson away from all of stock market history, it should be “the less you pay for an asset, the more you will earn from it. Buying cheap assets forces you to buy what others are selling.”
There are many ways to measure a stock’s cheapness, but one of the best is to compare a company’s free cash flow to its stock price. Value is defined as current share price divided by free cash flow (operating cash flow less capital expenditures and dividend payments) per share for the trailing 12 months. Lower values are better because they imply cheaper valuations.
The best way to measure earnings quality is to subtract earnings from operating cash flows and divide by total market capitalization. The higher the ratio, the stronger the company’s cash flows (and therefore the stronger their earnings).
Companies whose CEOs pay back stakeholders (through dividends, share buybacks and paying down debt) have historically outperformed stocks of companies whose CEOs dilute their shareholders’ stakes (no dividends, take on more debt and issue more shares of stock).
Shareholder orientation can be gauged by looking at cash from financing in relation to market capitalization. A lower value indicates that the company is shareholder friendly.
Return on invested capital (ROIC) measures how much profit is being realized from capital invested by a company. It measures net operating profits after taxes (NOPAT) relative to shareholder equity and debt. Higher values are better because they signal that a company is more profitable relative to every dollar of its total capital.
Relative price strength calculates how well a stock has performed against a benchmark, such as the S&P 500 index. Relative price strength rank compares the relative price strength for a stock to all other stocks, with higher values implying better relative price performance. Higher values are better because stocks with better relative price performance tend to continue outperforming.
To test how the five factors worked together, O’Shaughnessy set up a strategy that ranked each company in the universe by each of the factors and then bought the 25 stocks with the best average ranking. The strategy was rebalanced on a rolling annual basis.
O’Shaughnessy reported that between January 1973 and June 2013, the 25-stock version of this strategy had an annualized return of 20.2% and an annual volatility (standard deviation) of 18.7%. O’Shaughnessy determined that the best benchmark against which to compare these results is an equal-weighted version of the entire stock universe—the full opportunity set from which the strategy can select. Over the same time period, this benchmark universe had an annual return of 11.7% and an annual volatility of 19.4%. AAII did not independently backtest the results.
O’Shaughnessy’s approach measures a stock’s cheapness by comparing a company’s free cash flow to its stock price. There are other measures of value like the price-earnings ratio and price-to-sales ratio.
As illustrated in the characteristics of the stocks currently matching the O’Shaughnessy Millennial Investor approach (presented in Table 1), the median value of the price-earnings ratio of 29.4 is above the 25.3 median value of all exchange-listed stocks. The median value of the price-to-sales ratio of 1.78 for the Millennial Investor strategy is below the 2.95 median value of all exchange-listed stocks.
The O’Shaughnessy approach looks at the 26-week relative price strength (a measure of momentum). The median value of the 52-week relative price strength of 23.1% is above the 16.3% median value of all exchange-listed stocks.
Looking at Table 1, the stocks currently meeting the O’Shaughnessy screen have a median five-year earnings growth rate of 4.4%, compared to 4.8% for all exchange-listed stocks. The median estimated earnings growth rate of these out-of-favor passing companies is 11.2%, while for all exchange-listed stocks it is 11.4%.
Rather than requiring absolute values for each criterion (e.g., return on invested capital of at least X%), O’Shaughnessy uses composite rank scores. A ranking is assigned to each criterion to determine how favorable or unfavorable a company is relative to all other stocks for that characteristic. A composite score is then calculated based on the rankings for each criterion.
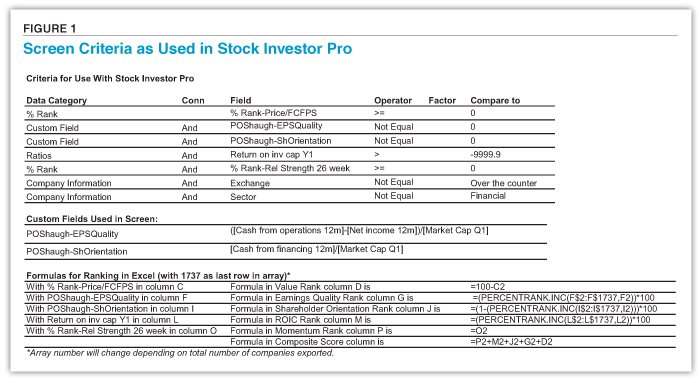
Three of the criteria, price-to-free cash flow (a measure of value), 26-week relative price strength (a measure of momentum) and return on invested capital, are built into AAII’s Stock Investor Pro. Rankings for price to free cash flow and relative price strength are also calculated by the program. Cash from operations less net income divided by market capitalization (earnings quality) and cash from financing divided by market cap (shareholder orientation) require the use of custom fields.
Calculating the rankings and the composite scores requires the use of a spreadsheet. The list of passing companies was exported to Microsoft Excel. The inverse of the price-to-free-cash-flow ranking was calculated to assign higher rankings to the stocks with the lowest valuations for purposes of determining the composite score. Rankings were calculated in Excel for earnings quality, shareholder orientation, return on invested capital and momentum. The individual ranks for each criterion were then added together to create a stock’s composite score. Higher scores are better.
The universe of stocks was restricted to exchange-listed stocks. Companies traded on the over-the-counter (OTC) market were excluded. Exchanges have listing requirements that establish minimums for company size, share availability and reporting. Stocks within the financial sector were excluded because of the structure of their financial statements. Passing stocks were required to have the data necessary for calculating all five criteria and the composite score. These restrictions narrowed the set of available stocks to 1,736.
Table 2 lists 25 stocks, ranked by composite score, that passed the O’Shaughnessy Millennial Investor screening strategy using data as of April 16, 2021.
Fields for use in Stock Investor Pro are shown in Figure 1. Click here to download instructions for creating the screen and a spreadsheet of the Excel ranking formulas.
Whether a millennial or younger, one of youth’s greatest advantages is the chance to build a successful portfolio by making early investments in the stock market. Young money—even in modest amounts—has significant potential.
The Big Question

Portfolio Strategies

Beginning Investor

JOHN P from OR posted over 5 years ago:
PAUL/BARBARA R from FL posted over 5 years ago:
DEREK H from CO posted over 5 years ago:
You need to log in as a registered AAII user before commenting.
Log InCreate an account