


Related

AAII Model Portfolios
For 2021 through August, small-cap value stocks are trouncing small-cap growth stocks, benefiting the Model Shadow Stock Portfolio.
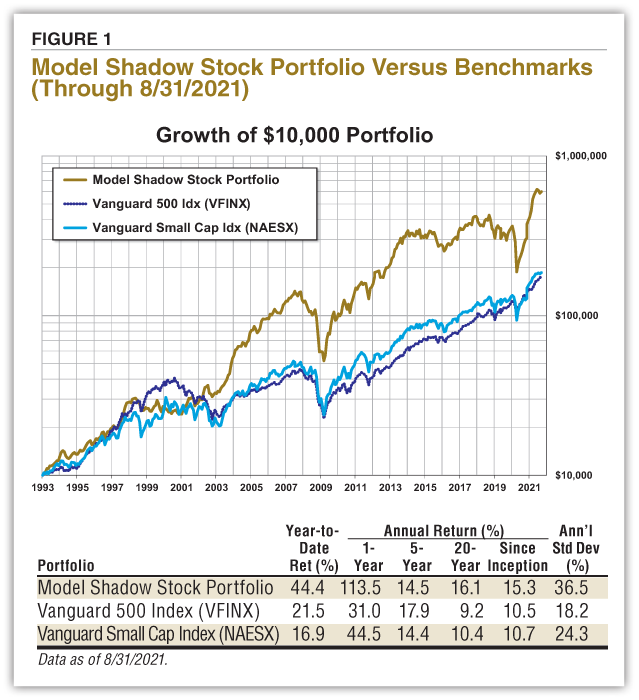
The Model Shadow Stock Portfolio bounced back during August with a 2.4% gain for the month, and it is now up 44.4% for the year. While large-cap growth stocks are dominating large-cap value stocks this year, smaller value-focused stocks like the holdings in the Model Shadow Stock Portfolio are outperforming their growth counterparts.
Overall, large-cap growth was the leading segment during the month with the Nasdaq 100 index gaining 4.3%, followed by a 3.0% gain for the S&P 500 index. The Vanguard Small Cap index fund (NAESX) and the DFA U.S. Micro Cap fund (DFSCX) were both up 2.0% during August.
Compared to the Model Shadow Stock Portfolio’s 44.4% year-to-date gain, the Vanguard Small Cap Index fund is up 16.9% and the DFA U.S. Micro Cap fund is up 26.4% over the same period. The S&P 500 as measured by the performance of the Vanguard S&P 500 Index fund (VFINX) is up 21.5% year to date.
In the large-cap segment, growth stocks are up 23.6% year to date through August while large-cap value is up 19.2% for the year. In the mid-cap segment, growth stocks are up 15.0% for the year, compared to a 25.7% gain for mid-cap value stocks. The largest disparity can be found among small-cap issues, with small-cap growth up only 6.9% year to date, while small-cap value stocks are up 25.4%.
Since its inception in 1993, the AAII Model Shadow Stock Portfolio has a compound annual average return of 15.3% versus the Vanguard 500 Index fund’s gain of 10.5% per year on average over the same period. The Vanguard Small Cap Index fund has posted an average annual gain of 10.7% since 1993.
Figure 1 summarizes the performance.
The Model Shadow Stock Portfolio is reviewed quarterly to determine portfolio sales and additions, a practice put in place since the portfolio’s inception in 1993. The quarterly review cycle of the Model Shadow Stock Portfolio is tied to the reporting cycle of most domestic publicly traded firms. The quarterly review looks to balance the cost of excessive trading of smaller-company stocks with the desire to react to meaningful company and market developments.
As we noted in the September AAII Journal, a special situation arises occasionally that requires more immediate action. New Home Company announced on July 23, 2021, that it had entered into a definitive merger agreement to be acquired by funds managed by affiliates of Apollo Global Management Inc. Under the terms of the agreement, Apollo Funds would commence a tender offer to acquire all outstanding shares of New Home Company for $9.00 per share in cash and take the company private. Since the market price largely reflected the acquisition price of $9.00 per share, the model portfolio position in New Home Company was sold on August 16, 2021, and the proceeds were held in cash until our quarterly review.
The quarterly review begins with an examination of the breakpoints for the smallest and cheapest deciles of domestically listed stocks. The primary Model Shadow Stock Portfolio selection criteria target the intersection of the smallest 10% of domestic stocks as measured by market capitalization, along with the “cheapest” 10% of domestic stocks as measured by the price-to-book-value (P/B) ratio. These decile breakpoints are determined by examining domestic companies that are listed on the New York Stock Exchange (NYSE) and then applying the size and value breakpoints for stocks listed on all domestic exchanges.
We used AAII’s Stock Investor Pro to examine the decile maximums and are leaving them unchanged. The NYSE price-to-book cutoff was 1.06 at the end of August, down from 1.11 in June, not significant enough to warrant a revision. The maximum minimum initial price-to-book ratio for determining qualifying stocks remains at 1.10. Stocks are sold for valuation if they exceed three times the minimum initial price-to-book ratio at the time of a quarterly portfolio review. A price-to-book cutoff of 1.10 is used to screen for stocks to add to the Model Shadow Stock Portfolio and 3.30 (1.10  (AP) 3) is the maximum price-to-book ratio to keep stocks in the portfolio.
The NYSE market-cap cutoff for the lowest decile was $460 million at the end of August, compared to $470 million in June. Here again the size change was not significant enough to merit an adjustment. The maximum minimum initial market capitalization for determining qualifying stocks remains at $500 million. Stocks are sold for valuation if they exceed three times the minimum initial market cap at the time of a quarterly portfolio review. A market-cap cutoff of $500 million is used to screen for stocks to add to the Model Shadow Stock Portfolio and $1.5 billion ($500 million (AP) 3) is the maximum market cap to keep stocks in the portfolio.
The other major factor that leads to portfolio turnover is tied to negative earnings. If a company reports trailing 12-month earnings from continuing operations that are negative, the stock is placed on probation; if a subsequent quarter has negative earnings prior to trailing 12-month earnings becoming positive, the stock is sold.
When available, adjusted (non-GAAP) earnings are used to put stocks on probation or sell them. These are earnings that have been adjusted to eliminate the impact of nonrecurring events such as markdown of inventory or goodwill. These are earnings reported in the media and firms reporting consensus estimates. The I/B/E/S adjusted earnings reported in Stock Investor Pro are used for Model Shadow Stock Portfolio decisions when they are available.
As we discussed in the September 2021 AAII Journal, as companies are bouncing back from the pandemic-induced economic slowdown last year, we are seeing the Model Shadow Stock Portfolio holdings coming off earnings probation and notes are being removed regarding the disparity between adjusted earnings and GAAP earnings.
The detailed Model Shadow Stock Portfolio purchase and sell rules, along with portfolio management tips, are available online (www.aaii.com/model-portfolios).
After conducting the quarterly review of the Model Shadow Stock Portfolio, Hibbett Inc. (HIBB) was removed from the tracking portfolio during regular trading hours on Thursday, September 9, for exceeding the size limit. With the proceeds from the sale of Hibbett and New Home Company, as well as the cash held in the portfolio, there were enough funds to purchase three new holdings at a level roughly matching the average position—Dixie Group Inc. (DXYN), Rayonier Advanced Materials (RYAM) and VOXX International Corp. (VOXX). Table 1 summarizes the changes. Table 2 shows the current stocks that make up the Model Shadow Stock Portfolio.
TABLE 1. Third-Quarter 2021 Transactions
Hibbett has been bumping up against the valuation and size maximums of the Model Shadow Stock Portfolio for some time now. Hibbett, formerly Hibbett Sports, is a leading athletic-inspired fashion retailer with nearly 1,100 Hibbett Sports and City Gear specialty stores. Hibbett operates stores in 35 states nationwide primarily in small and mid-sized markets in the U.S.
Hibbett has benefited from increased at-home recreational activity triggered by the coronavirus pandemic. The stock was trading at around 15% off of its 52-week high price but was up over 85% for the year as of September 7. At the time of our quarterly review, Hibbett exceeded the market-cap sell cutoff of $1.5 billion with a market cap of $1.58 billion. As stated, it is the policy of the Model Shadow Stock Portfolio to sell a stock once its market cap reaches three times the initial purchase limit of $500 million.
TABLE 2. Model Shadow Stock Portfolio
As of September 7, 27 stocks met the initial selection criteria for the Model Shadow Stock Portfolio. This is up from 20 passing companies last month. AAII members can see and research which companies are currently passing the initial selection criteria in the Shadow Stock Ideas table at www.aaii.com/model-portfolios.
Seven stocks already in the Model Shadow Stock Portfolio passed the updated criteria at the time of the review: Ampco-Pittsburgh Corp. (AP), Hurco Companies Inc. (HURC), Key Tronic Corp. (KTCC), Mesa Air Group (MESA), Orion Group Holdings Inc. (ORN), SIFCO Industries Inc. (SIF) and Strattec Security Corp. (STRT).
The remaining 20 qualifying stocks were examined to ensure adequate liquidity, timely financial filings and appropriate industry and foreign considerations. Price momentum is used as the tiebreaker among qualifying stocks. The remaining stocks were ranked using the weighted relative strength ranking, which considers price performance over the last year but places a higher weight on the most recent quarterly price performance.
Dixie Group is a marketer and manufacturer of carpet and rugs to high-end residential customers through the Fabrica International, Masland Residential and Dixie Home brands. High-end carpet and rugs for commercial applications are marketed by AtlasMasland.
Dixie Group has a book value per share of $4.34 as of June 26. If you wish to stay within the 1.10 price-to-book-value maximum, you should pay no more than $4.77 per share (4.34 (AP) 1.10). However, if the stock price has moved up after being added to the portfolio, you can still purchase the stock unless the price-to-book ratio goes above 1.21, which equates to a price of $5.25 per share. To calculate the maximum purchase price based on the maximum desired price-to-book ratio, multiply the current book value per share ($4.34 for Dixie Group) by the maximum price-to-book ratio to be considered for the Model Shadow Stock Portfolio (currently 1.10, or 1.21 for loosened consideration).
(RYAM)Rayonier Advanced Materials is a global supplier of high-purity cellulose specialties products, a natural polymer for the chemical industry. The company’s facilities in the U.S., Canada and France can produce over one million metric tons of high purity cellulose products for use in a wide range of industrial and consumer products such as filters, cosmetics, textiles and pharmaceuticals. Additionally, the company produces lumber for use in building and construction, as well as pulp and paper products used in packaging, print and writing materials.
Rayonier Advanced Materials has a book value per share of $12.36 as of June 26. If you wish to stay within the 1.10 price-to-book-value maximum, you should pay no more than $13.60 per share (12.36 (AP) 1.10). However, if the stock price has moved up after being added to the portfolio, you can still purchase the stock unless the price-to-book ratio goes above 1.21, which equates to a price of $14.95 per share.
VOXX International is an international manufacturer and distributor in the automotive electronics, consumer electronics and biometrics industries. The company produces a wide array of products from automotive obstacle-sensing systems to home theater systems.
VOXX International has a book value per share of $16.90 as of May 31. If you wish to stay within the 1.10 price-to-book-value maximum, you should pay no more than $18.59 per share (16.90 (AP) 1.10). However, if the stock price has moved up after being added to the portfolio, you can still purchase the stock unless the price-to-book ratio goes above 1.21, which equates to a price of $20.45 per share.
The next quarterly review of the Model Shadow Stock Portfolio will take place following the end of November 2021. In the meantime, you can follow the portfolio in the Shadow Stocks area on AAII.com. To receive monthly email updates along with alerts to any changes made to the portfolio, please sign up at www.aaii.com/email.
AAII Model Portfolios
AAII Model Portfolios
AAII Model Portfolios

MICHAEL C from MI posted over 4 years ago:
JEAN H from IL posted over 4 years ago:
You need to log in as a registered AAII user before commenting.
Log InCreate an account