



Related

AAII Model Portfolios
Strong recent performance lifted the portfolio out of its bear market run that stretched for two and one-third years.
by John Bajkowski | May 2021
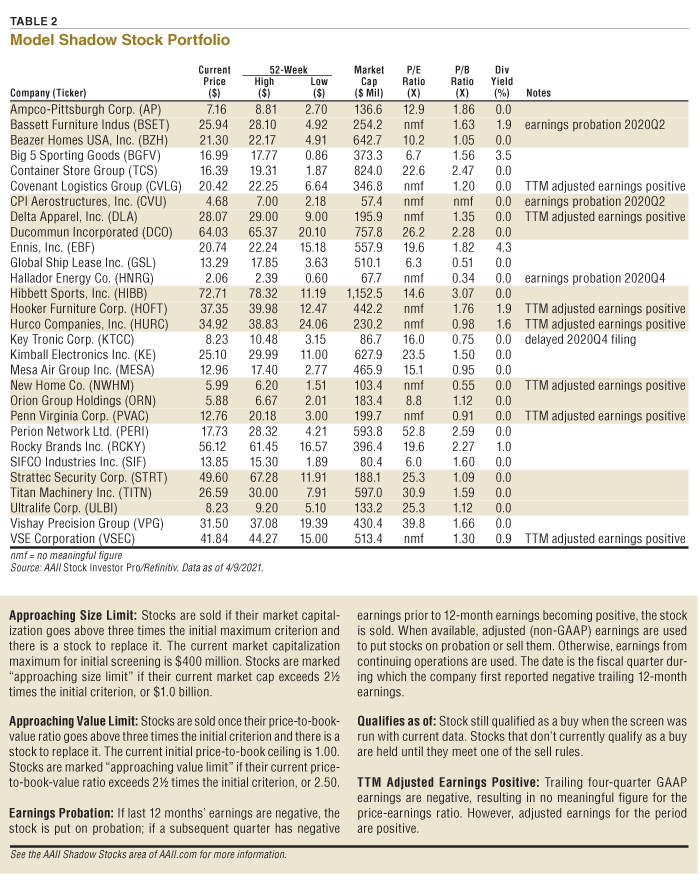
What a difference a year makes. We are now 12 months into the bull market run that is producing eye-popping performance numbers. The S&P 500 index as measured by the Vanguard 500 Index fund  (VFINX) is up 56.2% over the last 12 months. The Vanguard Small Cap Index fund (NAESX) is up 87.5%, and the Model Shadow Stock Portfolio has gained 203.5% over the last 12 months. Table 1 shows the portfolio’s performance figures against these comparisons over various time periods. Table 2 shows the current holdings of the Model Shadow Stock Portfolio.
The Model Shadow Stock Portfolio gained 6.5% during March, bringing its year-to-date gain to 37.5%. In contrast, the S&P 500 as measured through the Vanguard 500 Index fund was up 4.4% in March and is up 6.2% year to date, while the Vanguard Small Cap Index fund gained 1.6% in March and is up 10.2% year to date through March. The DFA U.S. Micro Cap fund (DFSCX) was up 4.7% during March and is up 21.3% during the first quarter of the year.
Small-cap stocks are outperforming large stocks this year, while value is also outperforming growth. Stocks in the energy (+30.8%), financial (+15.9%) and industrial (+11.4%) sectors are the best-performing groups in the market this year. Sectors that are lagging this year include consumer staples (+1.2%), information technology (+2.0%) and utilities (+2.8%). Basically, the weakest market segments and sectors last year are leading the market during the first quarter of 2021.
The Model Shadow Stock Portfolio has been in operation for just over 28 years. Its 15.4% annualized rate of return since inception is meaningfully greater than that of the Vanguard 500 Index fund, which gained 10.1% over the same time period, but that higher return has come with more frequent corrections and bear market periods for the Model Shadow Stock Portfolio.
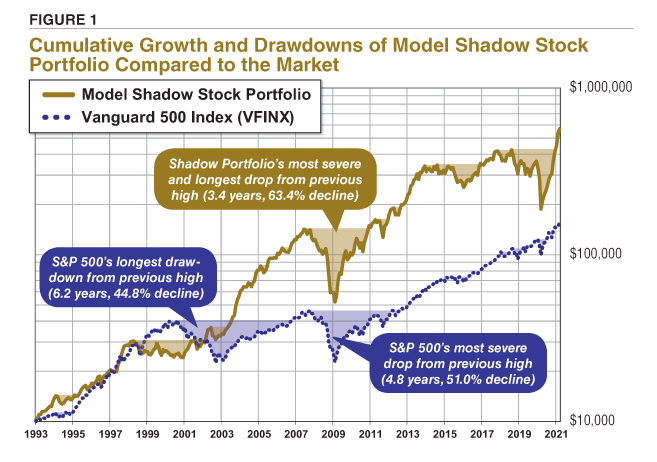
Generally, riskier and less-liquid assets are the stronger-performing groups during a recovery. During the financial crisis, the Model Shadow Stock Portfolio lost more than the large-cap Vanguard 500 Index fund (down 63.4% versus 51.0%, respectively) but recovered to its previous high more quickly (3.4 years versus 4.8 years, respectively). It is important to note that past patterns do not always repeat, but it is helpful to study historical patterns.
The Model Shadow Stock Portfolio’s strong recent performance lifted the portfolio out of its bear market run that stretched for two and one-third years—from September 2018 through December 2020. From the end of August 2018 through end of March 2020 the Model Shadow Stock Portfolio lost 55.9%. The portfolio then only needed nine months to recoup its losses and start to hit new highs.
Drawdowns measure the severity of a loss, while duration measures the length of the bear market. The drawdown is the percentage decline from a prior high to the bear market bottom. For its most recent bear market period, the Model Shadow Stock Portfolio had a drawdown of 55.9%.
The length of a bear market is generally referenced two ways—the time from the market top to the bear market bottom or time for a full recovery from the past market top to a new market high. A full time to recovery duration encompasses the length of the market fall and a portion of the subsequent bull market. For the most recent bear market, the Model Shadow Stock Portfolio took 19 months to hit its bottom and 28 months to recoup its loss and hit a new high value.
We examined the monthly total returns of the Model Shadow Stock Portfolio along with the Vanguard 500 Index fund to gain a sense of the frequency, duration and severity of corrections and bear markets over its 28-year history.
Figure 1 shows the cumulative growth coupled with the drawdowns, which are shaded. The chart provides visual illustration of the severity and duration of the drawdowns for the model portfolio and Vanguard 500 Index fund, while Table 3 summarizes the data. The drawdown durations in the table reflect the time needed before the full loss is recouped, not just when the downturn is reversed.
Corrections are generally classified as declines of 10% or greater. The Model Shadow Stock Portfolio has had 10 observed corrections, and five of them have turned into bear markets of 20% or greater. The average correction has been 1.5 years in length, with an average drawdown of 25.0%. The longest correction for the Model Shadow Stock Portfolio was 3.4 years and had a drawdown of 63.4% (July 2007 to November 2010).
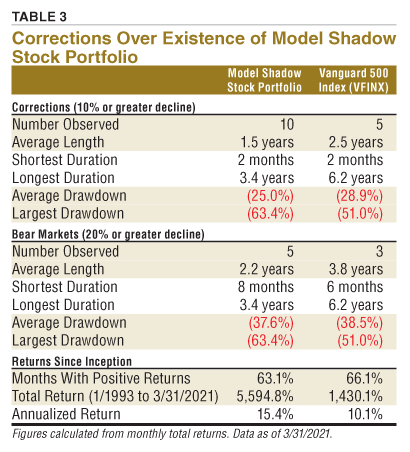
The Vanguard 500 Index fund has had five observed corrections and three of them have gone on to become bear markets of 20% or greater over the same time period. The average correction has been 2.5 years in length with an average drawdown of 28.9%. The longest correction (September 2000 to October 2006) was 6.2 years with a drawdown of 44.8%, but the greatest drawdown of 51.0% was with the 2007 bear market that lasted 4.8 years (November 2007 to July 2012).
On average, the Model Shadow Stock Portfolio has been up 63.1% of individual months during its existence. This means of course that it has had monthly losses just under four out of 10 months. In contrast, the Vanguard 500 Index fund has had positive monthly returns 66.1% of the time, or down months 33.9% of the time over the same time period.
As shown in Table 3 and Figure 1, the Model Shadow Stock Portfolio has more frequent corrections and bear market cycles than the S&P 500, but the down periods have generally been shorter in duration and bull market reversals stronger.
The next portfolio review will take place around the end of May, and any changes made then will be reported in the July 2021 AAII Journal. You can keep abreast of the Model Shadow Stock Portfolio on AAII.com at www.aaii.com/model-portfolios. To receive monthly email updates along with alerts to any changes made to the portfolio, please sign in to AAII.com and go to www.aaii.com/email.
AAII Model Portfolios
AAII Model Portfolios

AAII Model Portfolios

KENNETH D from CO posted over 5 years ago:
RON S from OH posted over 5 years ago:
JEAN H from IL posted over 5 years ago:
CHARLES R from IL posted over 5 years ago:
CHARLES R from IL posted over 5 years ago:
KENNETH D from CO posted over 5 years ago:
You need to log in as a registered AAII user before commenting.
Log InCreate an account