


Related

PRISM Wealth-Building Process
The effect of the large variability in short-term stock market returns is diminished with longer holding periods.
by John Bajkowski | March 2021

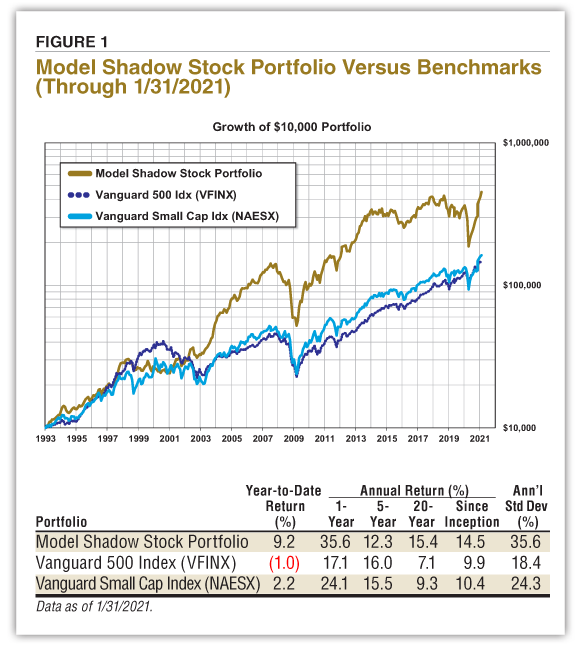
The Model Shadow Stock Portfolio continued its strong rally since suffering a severe downturn in the first quarter of 2020. The longest bull market on record was followed by the shortest bear market in history—33 days. The Model Shadow Stock Portfolio experienced a 48.5% loss in the first quarter of 2020 but is now up 141.1% since the end of March 2020. By way of comparison, the S&P 500 index as measured by the Vanguard S&P 500 Index fund  (VFINX) is up 45.7% and the Vanguard Small-Cap Index fund (NAESX) is up 73.9% since the end of March 2020.
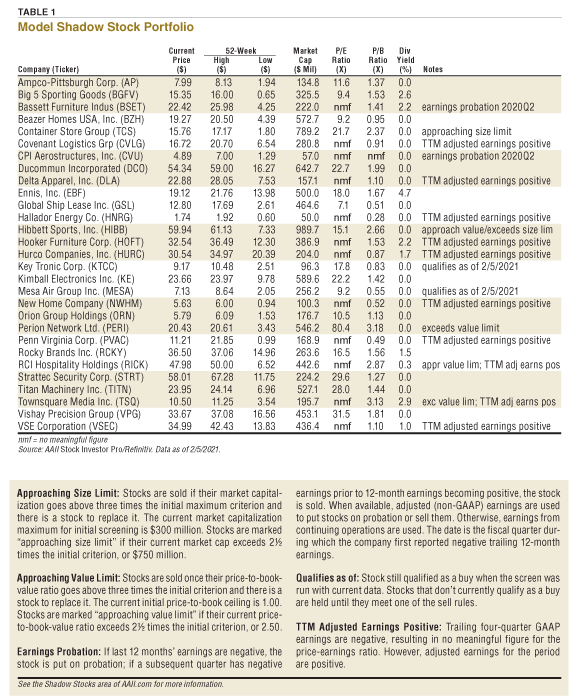
Since its inception in 1993, the AAII Model Shadow Stock Portfolio has a compound annual average return of 14.5% versus the Vanguard 500 Index fund’s annual return of 9.9%. Over the same period, the Vanguard Small-Cap Index fund posted an average annual gain of 10.4%. Figure 1 summarizes the long-term performance. Table 1 shows the stocks that currently make up the Model Shadow Stock Portfolio.
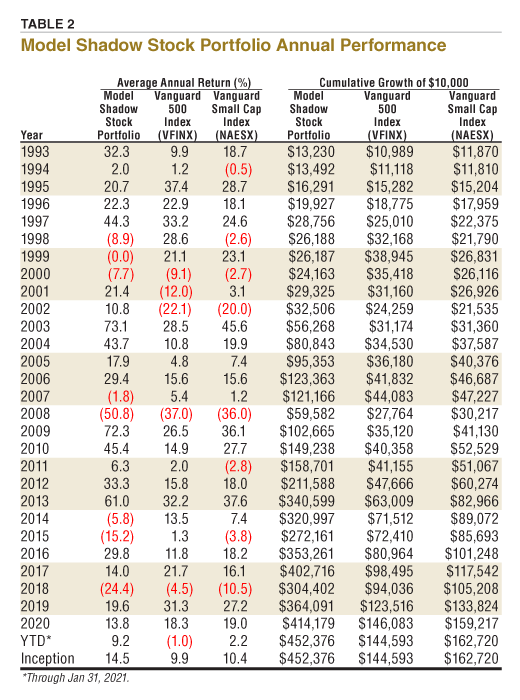
As noted in Table 2, the Model Shadow Stock Portfolio gained 13.8% during the 2020 calendar year. The annual gain is slightly below the long-term compound annual return of 14.5% of the Model Shadow Stock Portfolio.
Even with a gain of 13.8% for 2020, the Model Shadow Stock Portfolio underperformed the Vanguard 500 Index fund, which gained 18.3% last year and the Vanguard Small-Cap Index fund which was up 19.0% during 2020.
The Model Shadow Stock Portfolio has now underperformed the Vanguard 500 Index fund over the last four calendar years but has a stronger longer-term record. This type of pattern is consistent with historical observations of the relative performance of small-company stocks to that of large-company stocks. Small-company stocks have outperformed large-company stocks over the long term, but they certainly do not best large-cap stocks every year, and they tend to exhibit streaks of outperformance followed by periods of underperformance.
Over its 28-year existence, the Model Shadow Stock Portfolio outperformed the Vanguard 500 Index fund in 16 of the 28 calendar years, or 57% of the years.
Since calendar years are somewhat arbitrary start and end dates, rolling periods are often used to smooth out seasonality. There have been 325 rolling 12-month time periods over the last 28 years.
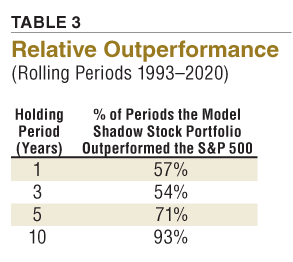
As Table 3 shows, the Model Shadow Stock Portfolio has outperformed the Vanguard 500 Index fund in 57% of the rolling one-year periods. When it comes to three-year holding periods, the Model Shadow Stock Portfolio has outperformed the Vanguard 500 Index fund in 54% of the periods, while outperforming the Vanguard 500 Index fund in 71% of the five-year rolling periods and in 93% of the rolling 10-year periods over last 28 years.
It is important to consider that a historical pattern may not repeat itself in the future, but longer holding periods normally provide a greater likelihood that stocks will exhibit their potential for positive returns. A very practical way to view investor risk is to examine the likelihood that your invested money will diminish from the time of the initial investment to the end of the holding period time frame and to keep in mind that the variability of the expected annual return is reduced with longer holding periods.
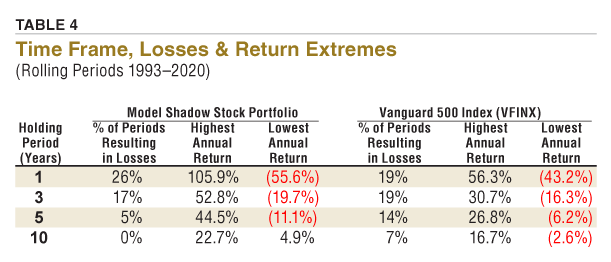
Table 4 assumes an investment in the Model Shadow Stock Portfolio or the Vanguard 500 Index fund and remains invested for the holding period indicated; the table indicates the percentage of times the portfolio or fund would have suffered a loss from 1993 through 2020. The table also notes the greatest compound annual gain and loss observed for the various holding periods.
The table helps to reinforce the important lesson that the effect of the large variability in short-term stock market returns is diminished with longer holding periods. The Model Shadow Stock Portfolio gained as much as 105.9% during one 12-month holding period, but it has also lost more than half of its value during a 12-month holding period.
About one in four one-year holding periods resulted in a loss for the Model Shadow Stock Portfolio. The number drops to 17% with three-year holding periods and 5% with five-year holding periods, and over its 28-year history there were no 10-year holding periods that resulted in a loss. An investment in the S&P 500 had a similar reduction in pattern with less likeliness of loss as the holding periods became longer. It should be emphasized that the stock market is risky for short-term holding periods, but as an investor’s time frame goes beyond five years, this risk is greatly diminished. When looking back at historical data, one must remember that past performance is no guarantee of future performance or risk.
Historically, stocks have offered the potential for greater returns over the long term compared to safer holdings such as Treasury bills, but you must have a longer time horizon to help realize the potential. The variability of returns—risk as measured by the chance of loss—normally goes down as the holding period gets longer. It should also be emphasized that an expected holding period can change due to unforeseen circumstances, and this possibility leaves an element of risk.
The next portfolio review will take place at the beginning of March, and any changes made then will be reported in the May 2020 AAII Journal. You can keep abreast of the Model Shadow Stock Portfolio on AAII.com at www.aaii.com/model-portfolios. To receive monthly email updates along with alerts for any changes made to the portfolio, please sign in to AAII.com and go to www.aaii.com/email. ▪
PRISM Wealth-Building Process
AAII Model Portfolios

Small Cap Value Investing

HUGO S from IL posted over 5 years ago:
ALEX F from CA posted over 5 years ago:
JAMES B from MO posted over 5 years ago:
MONTE M from KS posted over 5 years ago:
CHARLES R from IL posted over 5 years ago:
You need to log in as a registered AAII user before commenting.
Log InCreate an account