


Related

AAII Model Portfolios
The cutoffs for the cheapest and smallest decile stocks have increased, prompting changes to the portfolio’s purchase and sell criteria.
by John Bajkowski | July 2021
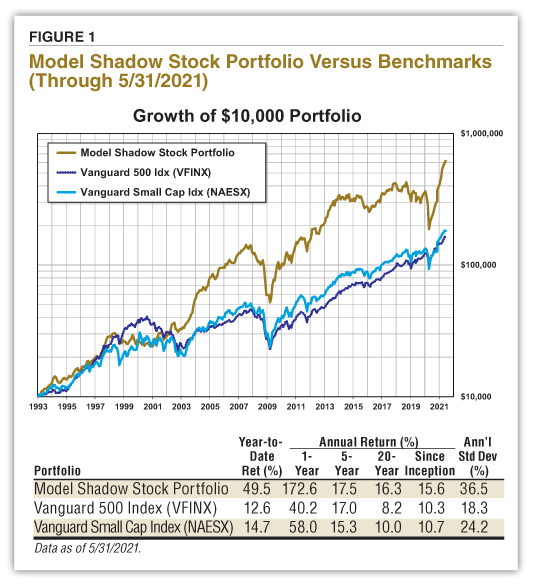
The Model Shadow Stock Portfolio continued its strong run with a 4.4% gain during May 2021. The Model Shadow Stock Portfolio is now up 49.5% for the first five months of the year and has posted positive monthly gains for 14 straight months. The S&P 500 index as measured by the performance the Vanguard 500 Index fund  (VFINX) had a gain of 0.7% during May and is now up 12.6% for the first five months of the year. The Vanguard Small Cap Index fund (NAESX) is up 14.7% for the year after gaining 0.1% in May. The DFA U.S. Micro Cap fund (DFSCX) gained 3.1% during May and is up 27.1% for the year.
Value stocks are significantly outperforming growth stocks during 2021 and small-cap stocks are outperforming large-cap stocks this year as well. In the large-cap segment, growth stocks are up 8.2% for the year, while large-cap value stocks are up 17.7% year to date. It is interesting to note that the information technology sector constitutes 40.1% of the S&P 500 Pure Growth index, while financials are the largest sector within the S&P Pure Value index with a weighting of 43.6%. In the mid-cap segment, growth stocks are up 11.1% for the year, while mid-cap value stocks are up 26.5%. Small-cap growth stocks are up 4.1% year to date, while small-cap value stocks are up 27.5%.
Since its inception in 1993, the AAII Model Shadow Stock Portfolio has a compound annual average return of 15.6% versus the Vanguard 500 Index fund’s gain of 10.3% per year on average over the same period. Over the same period, the Vanguard Small Cap Index fund posted an average annual gain of 10.7%. Figure 1 summarizes the performance.
The Model Shadow Stock Portfolio is reviewed quarterly to determine portfolio sales and additions, a practice put in place since the portfolio’s inception in 1993. The review cycle is tied to the standard quarterly reporting cycle of most publicly traded firms in the U.S. Companies are examined for violating the earnings, valuation, size and age rules of the Model Shadow Stock Portfolio.
The primary Model Shadow Stock Portfolio selection criteria target the intersection of the smallest 10% of domestic stocks as measured by market capitalization, along with the “cheapest” 10% of domestic stocks as measured by the price-to-book-value (P/B) ratio. These decile breakpoints are determined by examining domestic companies that are listed on the New York Stock Exchange (NYSE) and then applying the size and value breakpoints for stocks listed in all domestic exchanges.
When the quarterly review was conducted at the start of June, the price-to-book cutoff for the lowest decile had increased to 1.11, 11% above the model portfolio’s maximum initial price-to-book ratio of 1.00. Therefore, the maximum minimum initial price-to-book ratio is being raised from 1.00 to 1.10. Stocks are sold for valuation if they exceed three times the minimum initial price-to-book ratio at the time of a quarterly portfolio review. We used a price-to-book cutoff of 1.10 to screen for stocks to add to the Model Shadow Stock Portfolio and 3.30 (1.10 (AP) 3) as the maximum price-to-book ratio to keep stocks in the portfolio.
The market-cap cutoff for the lowest decile is currently $470 million, compared to the $370 million maximum in March, so the size cutoff was also adjusted for the Model Shadow Stock Portfolio during the quarterly review from $400 million to $500 million. The maximum market cap for inclusion in the Model Shadow Stock Portfolio is now $500 million, and holdings are sold if their market cap goes above three times the initial criterion at the time of the quarterly review: $1,500 million.
The other major factor that leads to portfolio turnover is tied to negative earnings. If a company reports trailing 12-month earnings from continuing operations that are negative, the stock is placed on probation; if a subsequent quarter has negative earnings prior to trailing 12-month earnings becoming positive, the stock is sold. When available, adjusted (non-GAAP) earnings are used to put stocks on probation or sell them. These are earnings that have been adjusted to eliminate the impact of nonrecurring events such as markdown of inventory or goodwill. These are earnings reported in the media and firms reporting consensus estimates. The I/B/E/S adjusted earnings reported in Stock Investor Pro are used for Model Shadow Stock Portfolio decisions when they are available.
A stock can also be sold if it has been held over four years if it also no longer meets the initial rules for qualifying and has not gained at least 10% annually from its purchase price and there is a new qualifying stock to replace it.
The detailed Model Shadow Stock Portfolio purchase and sell rules, along with portfolio management tips, are available online (www.aaii.com/model-portfolios).
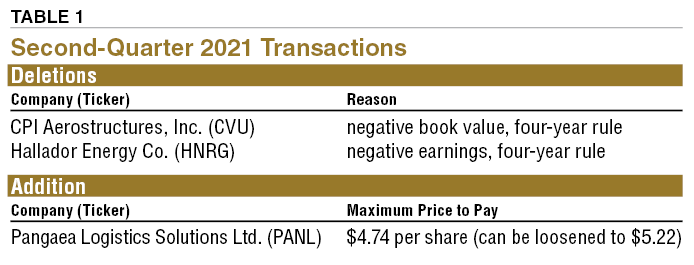
After conducting the quarterly review of the Model Shadow Stock Portfolio, CPI Aerostructures Inc. (CVU) and Hallador Energy Co. (HNRG) were removed from the model portfolio. With the proceeds from these two sales, as well as the cash held in the portfolio, there was only enough funds to purchase one new holding—Pangaea Logistics Solutions Ltd. (PANL). Table 1 summarizes the changes. Table 2 shows the current stocks that make up the Model Shadow Stock Portfolio.
Table 2. Model Shadow Stock Portfolio
(CVU)As we have previously noted, on February 14, 2020, CPI Aerostructures announced that it prematurely or inaccurately recognized certain revenues and would need to restate prior-period financial statements. Last August, the company provided restated financials for 2018 and published its 2019 results. Because of the restatement, the firm’s equity or book value was adjusted down and became negative. With a negative book value, one cannot calculate a meaningful price-to-book-value ratio.
CPI Aerostructures was removed from the portfolio because the firm is not trading with a meaningful price-to-book ratio, and the price-to-book ratio is the primary valuation metric used to select and remove stocks from the Model Shadow Stock Portfolio.
CPI Aerostructures was added to the Model Shadow Stock Portfolio on May 30, 2017, and is down 53.0% since purchase, also triggering a sale based upon the “four-year rule.” The four-year rule seeks to sell stocks that have been in the portfolio for a meaningful period of time and are underperforming the market, when qualifying stock candidates exist. Stocks are sold based on the four-year rule if they have been held for over four years, they do not currently qualify for inclusion in the portfolio, they are up less than 10% annually since purchase and there are qualifying stocks available to replace them.
(HNRG)Hallador Energy is an energy exploration company focused on developing coal reserves in the Illinois Basin.
Hallador Energy is primarily involved in mining coal for the electric power generation industry, but it has also branched out into gas exploration, generation of renewable energy and energy logistics.
Hallador Energy was removed from the portfolio because of the Model Shadow Stock Portfolio’s negative earnings rule. On May 3, 2021, the company reported an adjusted fiscal first-quarter loss of $0.07 per share, while trailing 12-month earnings remained negative. Adjusted trailing 12-month earnings per share first turned negative on March 9, 2021, when the company reported a loss of $0.15 per share on adjusted fourth-quarter earnings.
It is the policy of the Model Shadow Stock Portfolio to sell a stock once its trailing 12-month adjusted earnings go negative and the company reports a quarterly loss in a subsequent quarter while trailing earnings are still negative.
Hallador Energy also met the four-year sell rule. Hallador Energy was added to the Model Shadow Stock Portfolio on September 1, 2016, and is down 53.4% since purchase, triggering a sale based upon the four-year rule, as explained above.
As of June 10, 16 stocks met the initial selection criteria for the Model Shadow Stock Portfolio. This is up from six passing companies last month; however, last month the price-to-book maximum was 1.00 and the market-cap ceiling was $400 million at the time. Using the old cutoffs, nine companies passed the initial selection criteria, compared to 16 companies with the new cutoffs. AAII members can see and research which companies are currently passing the initial selection criteria in the Shadow Stock Ideas table at www.aaii.com/model-portfolios.
Five stocks already in the Model Shadow Stock Portfolio passed the updated criteria at the time of the review: Hurco Companies Inc. (HURC) Key Tronic Corp. (KTCC), Mesa Air Group (MESA), Orion Group Holdings Inc. (ORN) and Strattec Security Corp. (STRT).
Note that Key Tronic is passing based upon older financials that may need to be revised. The company disclosed on February 10, 2021, that during the preparation of its quarterly filings, it received a notification from an employee regarding “irregularities of the classification of inventory between raw material and work-in-process at a production facility.” The company continues to perform an internal investigation. At the time of the disclosure, Key Tronic stated that it did not anticipate a material adverse impact on its historical financial statements.
The remaining 11 qualifying stocks were examined to ensure adequate liquidity, timely financial filings and appropriate industry and foreign considerations. Price momentum is used as the tiebreaker among qualifying stocks. The remaining stocks were ranked using the weighted relative strength ranking, which considers price performance over the last year but places a higher weight on the most recent quarterly price performance.
(PANL)Pangaea Logistics is a U.S.-based maritime logistics and transportation company servicing a broad base of customers that require the transportation of a wide variety of dry bulk cargoes. The company operates a fleet of approximately 45 to 60 Supramax, Panamax and Handymax vessels, of which 21 are owned or partially owned. Pangaea Logistics is a leader in the high ice class sector, secured by its control of the majority of the world’s large dry bulk vessels with ice class 1a designation.
Pangaea Logistics has a book value per share of $4.31 as of March 31, 2021. If you wish to stay within the 1.10 price-to-book maximum, you should pay no more than $4.74 per share (4.31 (AP) 1.10). However, if the stock price has moved up after being added to the portfolio, you can still purchase the stock unless the price-to-book ratio goes above 1.21, which equates to a price of $5.22 per share. To calculate the maximum purchase price based on the maximum desired price-to-book ratio, multiply the current book value per share ($4.31 for Pangaea) by the maximum price-to-book ratio to be considered for the Model Shadow Stock Portfolio (currently 1.10, or 1.21 for loosened consideration).
We think you’d like this related webinar! Individual Investor Show: Cryptocurrency, First Cut Stock MVPs and Shadow Stock Changes
The next quarterly review of the Model Shadow Stock Portfolio will take place following the end of August 2021. In the meantime, you can follow the portfolio in the Shadow Stocks area on AAII.com. To receive monthly email updates along with alerts to any changes made to the portfolio, please sign up at www.aaii.com/email.
AAII Model Portfolios

AAII Model Portfolios

AAII Model Portfolios

Padmanabh S from NY posted over 5 years ago:
You need to log in as a registered AAII user before commenting.
Log InCreate an account