


Related

AAII How-To
Analysis of rolling 25-year periods showed rebalancing can lead to greater ending wealth for a hypothetical retirement portfolio by shifting dollars from bonds to equities during bear markets.

Charles Rotblut leads a class in AAII's new Essential Investing Video Course. Go to https://www.aaii.com/ves for more information and to subscribe.
My ongoing analysis of rebalancing has shown its importance to investors who desire to maintain a specified allocation for achieving their goals. Periodic rebalancing has the added benefit of reducing the volatility of returns relative to a portfolio that is not rebalanced. Rebalancing can be particularly important to investors who either are or will soon be taking withdrawals, such as retirees and those approaching retirement age.
For those who are willing to endure higher volatility, periodic rebalancing can be beneficial if more than one asset class group is used. An example would be an investor who desires to have X% of their portfolio allocated to large-cap stocks, Y% in small-cap stocks and Z% in foreign stocks. Rebalancing, in this case, would keep any single asset class group from having a portfolio weighting that is too large or too small.
I share data from rolling 25-year periods to demonstrate how portfolio rebalancing can be beneficial by preserving desired allocations. In addition, I discuss the signals to rebalance given by my hypothetical portfolios at the end of 2021.
Before getting into the details, here are a few takeaways:
Excel worksheet download available:
My analysis of rebalancing is based on hypothetical portfolios using the AAII Moderate Investor Asset Allocation model. This model expands on the traditional 60% equity/40% fixed-income allocation strategy, by incorporating greater diversification on the equity side and shorter duration (meaning less interest rate sensitivity) on the bond side.
Specifically, the Moderate Investor allocation model calls for allocating 20% in large-cap stocks, 15% in mid-cap stocks, 10% in small-cap stocks and 15% in international stocks. On the bond side, it calls for a 30% allocation to intermediate-term bonds and a 10% allocation to short-term bonds. (I used a single intermediate-term bond fund in our rebalancing models.) Figure 1 shows the characteristics and hypothetical returns for the three allocation models.
Figure 1. AAII Asset Allocation Models
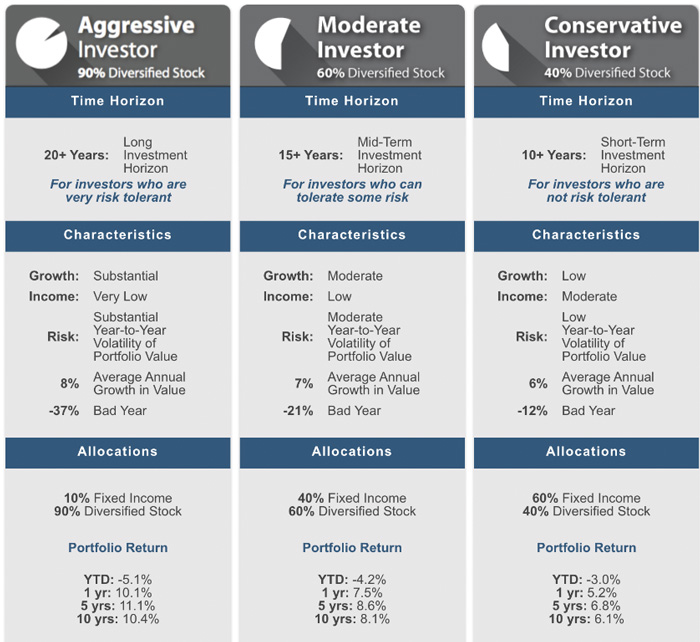
Source: AAII Asset Allocation Models. Data as of January 31, 2022.
The portfolios here use Vanguard mutual funds to replicate the returns an investor could have realized after fund fees are factored in. The Investor shares class of funds was used for the period of 1988 through 2017. The Admiral shares class of funds was substituted in 2018 because Vanguard stopped offering the Investor shares class to most investors. Part of the goal of this study is to show the returns an investor could have realized in a real-world portfolio, gross of taxes and specific account fees (such as those charged by a workplace retirement plan).
The full analysis uses data for the period of 1988 through 2021. The starting date is January 1988 because this was the first calendar year with full-year return data for some of the funds used in the models. The rolling 25-year period models are subsets with starting dates ranging from 1988 to 1997.
The models are updated annually using year-end return data. A downloadable spreadsheet with the data for the full 34-year period and a thorough explanation of the calculations is included in the online version of this article.
The hypothetical portfolios are either non-withdrawal or withdrawal. No withdrawals are taken out of the first one (the non-withdrawal portfolio). The second, the withdrawal portfolio, assumes that a retiree makes annual withdrawals based on an inflation-adjusted 4.5% rate.
One question I’ve received over the years has been about using a different allocation. The answer is that the returns will change, but not the lessons about rebalancing.
If you believe following a specific allocation strategy is important, I encourage you to focus on the observations only and not the specific allocation used here. As you will see, rebalancing preserves a portfolio’s allocation by requiring periodic adjustments. Not rebalancing, in contrast, causes a portfolio’s allocation to drift far off its original target. I discuss rebalancing during a rising-interest-rate environment later in this article.
Two types of portfolios are presented in Table 1 (cumulative returns) and in Tables 2 and 3 (rolling 25-year periods) to account for different investor life-cycle stages.
Table 1. Performance of the Three Strategies
The non-withdrawal portfolios have no outflows. The hypothetical portfolios assume a lump-sum investment was made at the portfolios’ inception dates with no additional dollars added.
Annual withdrawals, such as those taken by a retiree, are used in the withdrawal portfolios. The withdrawal strategy used is retired financial planner William Bengen’s 4.5% inflation-adjusted withdrawal rate. A withdrawal equal to 4.5% of the portfolios’ balance at the end of the first year is taken. This initial withdrawal rate is then increased each year by the rate of inflation.
(The year-over-year change in the consumer price index for all urban consumers is used to determine the inflation adjustment. This benchmark can be substituted with a different measure.)
A big threat to anyone taking withdrawals is sequence risk. It refers to an ill-timed period of bad returns.
Sequence risk is a particular threat to retirees who are dependent on portfolio withdrawals for income. Investors in this scenario will incur periods where they will need to withdraw dollars at the very time their portfolios have fallen in value. These withdrawals reduce the amount left in the portfolio to benefit from the eventual recovery in market conditions.
The impact of sequence risk is evident in the rolling period analysis for the withdrawal portfolios. Consider the 25-year period of 1997–2021. This period included the go-go years of the late 1990s and the long bull market of 2009–2020. Yet, an investor who retired at the start of this period, took portfolio withdrawals and never employed a rebalancing strategy would have ended up with less wealth than an investor who did rebalance (see Table 2).
Table 2. 25-Year Rolling Period Returns for the 4.5% Withdrawal Portfolios
Table 3. 25-Year Rolling Period Returns for the Non-Withdrawal Portfolios
The bursting of the dot-com bubble led to a bear market striking early in this scenario. Portfolios with a significant weighting to stocks fell in value during 2000, 2001 and 2002. Then, a few years later, the financial crisis of 2007–2009 struck. The combination of this one-two punch created problems for the non-rebalanced withdrawal portfolio. In our models, which assume withdrawals are taken evenly out of every fund held, both the international stock and small-cap allocations were completely drained by 2014 and 2017, respectively.
These dual bear markets did not spare the rebalanced withdrawal portfolio. This should not be surprising, as rebalancing is not a strategy for avoiding bear markets. Rather, it is a strategy for preserving allocation. But because the rebalanced withdrawal portfolio purposely shifted dollars from bonds to equities during bear markets, it went on to realize greater ending wealth.
Consider the changes in allocation. At the end of 2007, the non-rebalanced withdrawal portfolio equity allocation was 58.4%. The equity allocation for the rebalanced withdrawal portfolio was slightly higher at 59.1%. Fast forward two years to the end of 2009, the non-rebalanced withdrawal portfolio had an equity allocation of 46.2% versus 64.7% for the rebalanced portfolio.
Two actions helped the rebalanced withdrawal portfolio during this period. First, at the end of 2006, the portfolio’s equity allocation was reduced from 65% down to 60%. Then, at the end of 2008, the rebalanced withdrawal portfolio’s equity allocation was raised from 43% to 60%. Both adjustments were made to get the portfolio’s allocation back to target. The actions kept the rebalanced withdrawal portfolio from being overly weighted to equities and then, later, from being too underweighted in equities.
Obviously, there is the appearance of market-timing here. It is coincidental. Rebalancing does not incorporate market forecasts. Rather, it adjusts the allocation when market conditions pull the weighting to any given asset class or asset class category too far in one direction.
Sequence risk is less of a threat to those who do not take withdrawals. Since the portfolio is left alone to recover, its value is restored when the market rebounds. You can see this in the returns shown in Table 3 for the non-withdrawal portfolios. The non-rebalanced non-withdrawal portfolio ended the 25-year period of 1997–2021 with a larger total value than the rebalanced non-withdrawal portfolio ($718,775 versus $702,846).
The non-rebalanced non-withdrawal portfolio incurred about 11% more volatility, however. I point this out because there is a psychological element to investing. An investor who is not able to stick with an allocation because the swings in their portfolio’s value are too large will fare worse than an investor who incorporates strategies like rebalancing.
I ran a panic scenario over the same period. This scenario assumed that an investor pulled out of the stock market whenever the value of their portfolio fell by more than 20% in a single calendar year. I then assumed the investor waited a full calendar year before getting back into stocks. This meant the investor pulled out at the end of 2002 and 2008 before getting back in at the end of 2003 and 2009. Just being out of the market during each of these two years reduced the ending portfolio value to $504,759. This equates to almost 30% less wealth than what the investor would have realized by either rebalancing or simply leaving their portfolio alone.
The long-term models signaled a need to rebalance at the end of 2021. Both the rebalanced non-withdrawal and the rebalanced withdrawal strategies required rebalancing.
The rebalanced non-withdrawal portfolio last required rebalancing following the end of 2017. At the end of 2021, the large-cap stock allocation was overweighted and the bond allocation was underweighted. The bond fund allocation was also underweighted in the rebalanced withdrawal portfolio. This latter portfolio was last rebalanced in 2019.
I walk you through the numbers first. Then I discuss the positives and challenges of doing this rebalancing given what we knew then and what we know now happened during the first month of 2022.
Let’s start with the returns over the last four years. Large-cap stocks, represented by the Vanguard 500 Index Admiral fund  (VFIAX), realized annualized returns of –4.5%, 31.5%, 18.4% and 28.7% for 2018, 2019, 2020 and 2021, respectively. Bonds, represented by the Vanguard Total Bond Market Index Admiral fund (VBTLX), returned 0.1%, 8.7%, 7.7% and –1.7% for the same years.
A $10,000 investment placed in large-cap stocks at the start of 2018 would have been worth $19,125 at the end of 2021. A $10,000 investment placed in the Vanguard Total Bond Market Index Admiral fund would have been worth $11,500 at the end of 2021. A simple allocation of 50% large-cap stocks and 50% bonds at the start of 2018 would have evolved into a 62.4%/37.6% mix.
The weightings for each of the model portfolios are not 50/50, but the example provides an idea of how allocations can shift over even short periods of time.
The rebalanced non-withdrawal portfolio’s actual allocation evolved from 60% stocks/40% bonds at the start of 2018 to 68.4%/31.6% at the end of 2021. The large-cap stock allocation was 26.3%, versus the target weight of 20%. The bond allocation was 31.6%, versus the target of 40%.
Large-cap stocks accounted for 24.3% of the rebalanced withdrawal portfolio at the end of 2021. The difference is because of both annual withdrawals and this portfolio being last rebalanced at the end of 2019, versus 2017 for the non-withdrawal portfolio. Though the large-cap allocation in the withdrawal portfolio wasn’t enough to trigger rebalancing, the overall mix of stocks and bonds was. At the end of 2021, the mix of equities and bonds was 66.2%/33.8%. All three of the domestic stock funds used delivered positive double-digit returns in both 2020 and 2021. The bond fund’s returns, as previously noted, realized a positive single-digit return in 2020 but declined slightly in 2021.
An investor making the decision to rebalance at the start of 2022 might have felt good about their decision to reduce exposure to equities given the downside moves in the stock prices we now know occurred in January.
Though this may seem like market timing, it’s not. Rebalancing is a strategy for maintaining a desired allocation. Signals to rebalance can occur right before a market move simply because one or more asset classes have moved too far in one direction.
An example is 2008. At the end of 2008, stock prices had fallen so much that a portfolio may have ended the year underweighted in stocks and overweighted in bonds. The then signal to rebalance wasn’t a call that the bear market was close to bottoming. Rather, it was a matter of market conditions driving the equity allocation below the investor’s acceptable range.
Rebalancing is a buy low, sell high strategy to the extent that bull markets and bear markets exert too much pressure on asset prices, moving allocations off target. When this happens, rebalancing prompts you to take profits from outperforming assets and to allocate those proceeds to underperforming assets in order to preserve the overall allocation.
But what if the macro-environment has you second-guessing the decision to rebalance? At the end of 2021, the likelihood of the Federal Reserve raising interest rates in 2022 was already well known to investors. Should such information change the decision to rebalance? No, it shouldn’t, if your portfolio has strayed too far away from your targeted allocation.

The decision about how you should allocate is different than whether you should rebalance. In our PRISM Wealth-Building Process, allocation decisions are made in Step 2, Recognizing Your Risk Tolerance and Allocation. The determination of whether rebalancing is required is made during Step 5, Monitoring Your Allocation, Progress and Life Stages. Rebalancing is part of monitoring, while allocation decisions are made earlier in the PRISM process.
Those who have concerns about rebalancing into bonds given the prospect of rising rates should review their goals and their risk tolerance. Combined, these will determine what type of allocation is best for you. If the decision is to maintain an allocation to less volatile assets but switch to investments better suited for a rising-interest-rate environment (e.g., perhaps you want to shift to Treasury inflation-protected securities, or TIPS, instead of traditional bonds), that decision is made as part of Step 4 in the PRISM Wealth-Building Process, Selecting and Managing Your Investments.
AAII How-To

PRISM Wealth-Building Process


D K from CA posted over 4 years ago:
D K from CA posted over 4 years ago:
D K from CA posted over 4 years ago:
D K from CA posted over 4 years ago:
JIM L from MI posted over 4 years ago:
GREGORY T from WI posted over 4 years ago:
ROBERT A from NC posted over 4 years ago:
WILLIAM E from WA posted over 4 years ago:
PAUL N from SD posted over 4 years ago:
STEVEN H from CA posted over 4 years ago:
WILLIAM W from FL posted over 4 years ago:
J M from NJ posted over 4 years ago:
NORMAN F from OH posted over 4 years ago:
You need to log in as a registered AAII user before commenting.
Log InCreate an account