


Charles Rotblut leads a class in AAII's new Essential Investing Video Course. Go to https://www.aaii.com/ves for more information and to subscribe.
Most AAII members hold individual stocks in their portfolios. So for our latest Big Question survey, we asked them what characteristics describe their approach to investing.
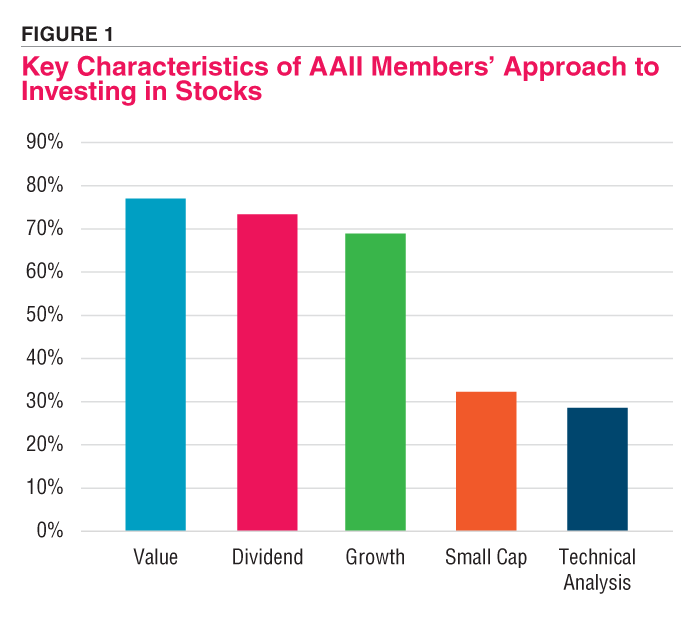
Value was more frequently mentioned as a key characteristic, listed by more than three-quarters of all respondents (77%). Dividends were a close second at 73%, followed by growth (69%) as Figure 1 shows.
The inclusion of more than one characteristic was not surprising. Many individual investors seek a combination of desirable traits in stocks. Jim Treonis said, “I prefer large-cap, dividend-paying stocks (dividend achievers). I do a value-oriented fundamental analysis of a stock, followed by technical analysis (Bollinger Bands, MACD, etc.).”
Many others told us that stability is a key part of their approach. Randy Moresi was one of them. “I seek out dividend-paying stocks with good prospects of dividend growth. They should be fundamentally sound companies with reasonable prospects for growth over the long run. I buy and hold unless I have totally missed.”
Individual investors also discussed combining growth and value characteristics. “I attempt to find GARP stocks: growth at a reasonable price,” explained Bob Lindinger. “I use the forward PEG ratio to determine if a stock’s price is reasonable. I want the PEG ratio to be 1.0 or less. I also want to see profits and excess cash flow. If the company pays a dividend or buys back shares, then it’s a sign of the company being shareholder focused.”
The Big Question survey is part of a periodic initiative to give AAII members a chance to talk about their investment decisions and challenges. Each survey asks what we’re describing as a “big question” about a subject of interest to many individual investors. A randomly selected group of AAII members is asked a specific question, as well as follow-up questions intended to provide more clarity and background.
Key Growth and Valuation Metrics
To gain greater insight into their approach to stock selection, we asked AAII members about which growth and valuation metrics they look at.
On the growth side, earnings are assigned the highest importance. Slightly more than two-thirds of all respondents (68%) said they look at historical earnings growth. About 54% look at projected earnings growth.
Growth in revenues was a comparatively less-used metric. Fewer than half of all respondents (44%) said they consider historical sales growth.
Tim Trowbridge seeks both sales and earnings growth. “I like to see five or more years of steady historical growth in sales and earnings. I also want companies to have a debt-to-equity ratio of less than 30%.”
“Consistent performance as evidenced by at least modest growth in sales and earnings and a stable or growing dividend,” is what Richard Halberg wrote. Overall, he tries “to identify stocks that [he thinks] are ‘on sale’ or at least fairly priced.”
For value, the price-earnings ratio was the most frequently looked at valuation ratio. Slightly more than three-quarters of respondents (76%) said they consider it. Ranking closely behind was dividend yield, chosen by 74% of all respondents. This is not surprising given the large number of respondents who said dividends are a trait they seek in a stock.
The price-to-book ratio, emphasized as a valuation metric by Benjamin Graham, is not a widely used metric among individual investors. Just 36% of respondents said they use it.
We commonly saw value combined with other traits. For instance, Andrew Milone combines “a low price-earnings ratio with prospects for growth, stable leadership and well-established companies.”
The strength of a company’s business model, including a competitive advantage over its peers, was another common key trait sought out in a potential investment candidate. Thomas (Tom) Booth, for instance, seeks companies with “strong sales, good earnings, good management, a competitive edge in their industries and good spending on research and development.”
Finding Stock Ideas
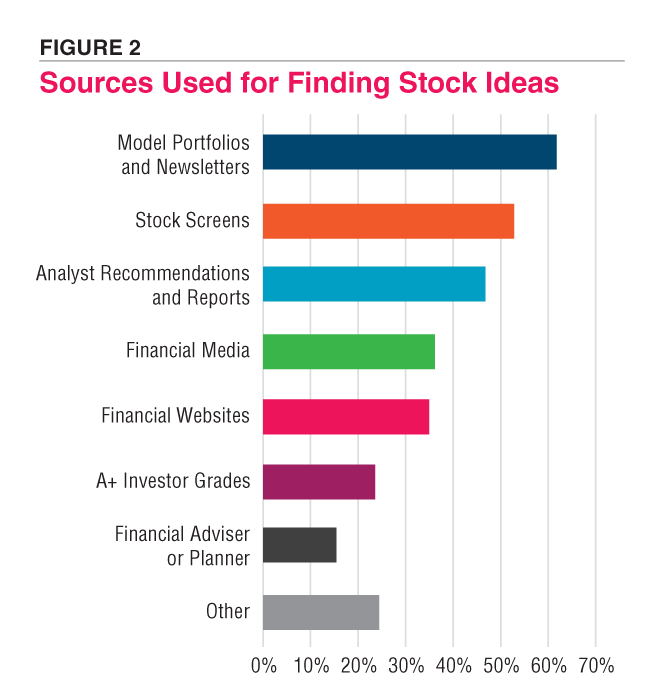
Individual investors find potential investment candidates from a variety of sources, as Figure 2 shows. Model portfolios and newsletters are the most common source of stock ideas, with 62% of survey respondents saying they use them. Stock screens are also very popular, with 53% of respondents using them. Recommendations and reports by analysts are used by 47% while 36% of surveyed AAII members told us that they get ideas from media outlets.
The primary source for finding potential investment candidates among many respondents was AAII.com. “AAII Dividend Investing for individual stocks,” wrote Shell Rubenstein. “I look for diversification among sectors, growth and value and market capitalization.” Rubenstein added, “my son and I choose mutual funds and exchange-traded funds (ETFs) jointly.”
Other AAII resources listed by survey respondents included the AAII Stock Screens, the Model Shadow Stock Portfolio and our Stock Investor Pro stock screening and database program. Though media outlets were frequently listed, no single source stood out. Rather, the open-ended responses included several publications, websites and networks. Mel Shapanka gets ideas from “AAII, Barron’s and Morningstar.”
Among the many AAII members who listed “other” was Rick Fell. He doesn’t “really have a primary source.” Rather, as Fell explained, “any time I come across a stock that might have potential interest, I investigate it. More often than not, I do not buy the stock, but sometimes I find a stock that I would like to add to my portfolio or put on my watchlist.”
Individual Investors Pay Attention to Stock Fundamentals
More than three-quarters of surveyed individual investors (78%) look at a company’s fundamentals before buying stock. Those data points include fundamental ratios and valuation ratios. Nearly half of respondents (48%) look at a company’s financial statements.
Several AAII members discussed doing their own number-crunching before buying a stock. Karl Johnson was one of them. “I have a spreadsheet that determines if earnings and dividend growth is reasonable, if the company is financially strong, as well as four valuation metrics.” Those metrics are “the company’s current price-earnings and price-to-sales ratios relative to the past five-year average, the current price-to-book ratio to the current S&P 500 price-to-book ratio and the current dividend yield to the five-year average.” In an email, Johnson explained that “if I am considering buying the stock, the metrics at least give me a good idea of whether the current market price is reasonable or way too high, in which case I would probably wait for a more reasonable price point.” More often, he uses the metrics to determine if a current holding has become overvalued.
Paul Rogers tries “to determine the expected five-year annual return after my initial screens for return on equity, dividends” and other fundamental metrics.
Many members include technical analysis when determining if a stock is worth adding to their portfolios. “I have a price profit target set before purchase. If my technical tools indicate a very high degree of likelihood that the price will move to my sell target soon, I will place a buy offer,” wrote Stuart Shapiro. He added, “My only additional important requirement for buying is for the price to be near support. My profit point is less than resistance.”
Research reports are frequently checked, as 63% of respondents said they look at them before hitting the buy button. It wasn’t uncommon for AAII members to say they use reports in conjunction with other analysis.
Bill Rudd’s process often starts with the stock screens on AAII.com. He looks “at the rankings by category, screening for the highest-ranked stocks.” He expounded by saying, “I am usually looking at a particular sector or area of the market, although I will purchase from general screens. I then compare the results to Fidelity’s ranking system and if they both concur, I give it strong consideration. I will then discuss with my financial adviser to make a final decision.”
Reasons for Selling a Stock
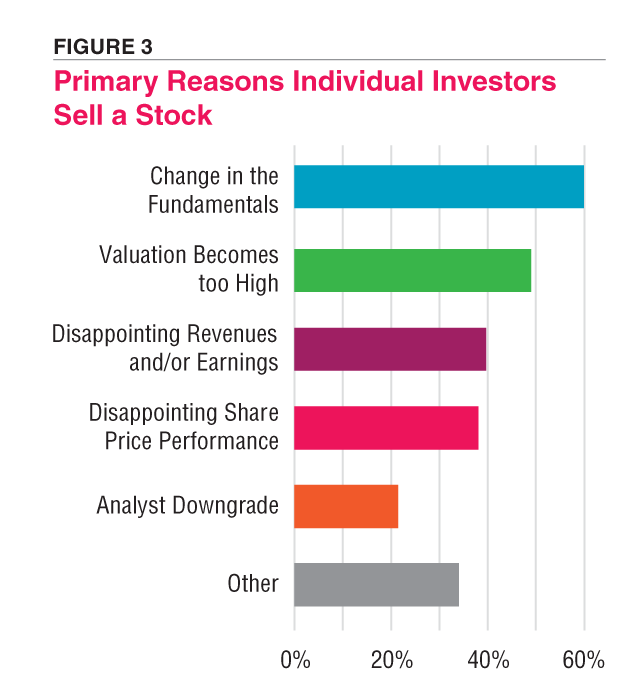
After asking about their approach to buying, we inquired about what prompts AAII members to sell a stock. Once again, the reasons varied but, as Figure 3 shows, a change in the fundamentals tops the list. Three out of five respondents listed this as the primary reason they sell a stock. High valuations were the second-most-cited reason, picked by 49% of all respondents. Notably, just 21% sell a stock primarily because an analyst downgraded their rating.
Several respondents listed more than one reason.
Bob Kohan was among those who use a change in the company or stock as a reason to “sell out of a position completely if something fundamentally changes within the company or industry that’s of a permanent nature.” Otherwise, “as long as a company continues to perform, I’ll keep it,” wrote Kohan.
We saw several members discuss using stops to limit losses. For instance, Ted Bergstrom will sell if a stock’s price “drops 10% to 12% below the purchase price and stays there for about 10 trading days.” He also looks for “special reasons” that would make him retain a stock. Those special reasons are “a general market retreat, the price action of the stock in question versus other stocks in the same sector, the price history and volatility of the stock in question.”
What Traits Do Individual Investors Consider When Buying Stocks? Video
We think you’d like this related webinar! Individual Investor Show: The Emotional Psychology and Behavior Behind Investing

Related

Related

PRISM Wealth-Building Process
Guidelines for Selecting Stocks for Your Portfolio
Discussion
FREE REPORT

AL B from IL posted over 4 years ago:
ALEX T from MA posted over 4 years ago:
BARRY J from TX posted over 4 years ago:
You need to log in as a registered AAII user before commenting.
Log InCreate an account