

Related

AAII Stock Ideas
The choice of a stock—and even whether to hold individual stocks instead of mutual funds or ETFs—should be reflective of each investor’s investment management preferences.

Charles Rotblut leads a class in AAII's new Essential Investing Video Course. Go to https://www.aaii.com/ves for more information and to subscribe.
There are more than 6,500 publicly traded stocks included in AAII’s Stock Investor Pro database. Choosing which one to invest in requires consideration of your portfolio needs and your preferences and constraints, as well the characteristics of the stock itself.
In this article, we address Step 4 of the PRISM Wealth-Building Process—selecting and managing your investments—as it relates to stocks. As is the case with mutual funds and exchange-traded funds (ETFs), discussed in the July AAII Journal (“Guidelines for Selecting Mutual Funds and ETFs”), the PRISM process helps you narrow down the large number of stocks to a manageable list. We’ll also provide guidelines from academic research and industry practitioners for selecting stocks based on widely followed investing styles.
Suggestions for which stock to buy are most commonly given from a bottom-up point of view. A bottom-up approach to investing calls for seeking out the best stock regardless of your allocation needs or preferences. These suggestions for stocks perceived as attractive investment candidates can come from analysts, portfolio managers, newsletter writers, pundits and even friends.
When your personal wealth-building process is not taken into consideration, a mismatch between the stock and your long-term strategy can emerge. A recommendation for an emergent, small-cap biotechnology stock does you little good if what you really need for your portfolio is a large-cap dividend-paying stock. Yes, the biotech stock may do well, but you will end up with more volatility and less portfolio income than you had been planning on.
PRISM follows a top-down approach. We believe an investor’s allocation should reflect their goals and risk tolerance. The choice of a stock—and even whether to hold individual stocks instead of mutual funds or ETFs—should be reflective of each investor’s investment management preferences. Put another way, your choice of a stock is an extension of:
This top-down approach personalizes the process of selecting a stock. PRISM leads you to consider only those stocks that are appropriate for you. One of the big advantages of PRISM is the clarity it provides. Rather than looking for a needle in a giant haystack, you are narrowing your search down to one small bale of hay.
The starting point for selecting a stock is your allocation needs. Specifically, what part of your allocation are you trying to fill?
At a very high level, we can divide stocks into two broad groups: domestic and international. Domestic stocks—shares of companies domiciled in the U.S.—are the ones most likely to be found in individual investor’s portfolios. (A bias toward companies domiciled in an investor’s home country has been documented around the world.) International stocks represent companies domiciled in other countries. (From the standpoint of allocation, we can divide international into developed countries and emerging market countries.) While foreign-country companies can seek a listing in the U.S. either directly or through American depositary receipts/shares (ADRs or ADSs), many are listed on foreign exchanges.
Both groups can be divided into size-defined categories: large-cap, mid-cap and small-cap stocks. Micro-cap stocks can arguably be added as a fourth category.
Most allocation models split equities into these groups and categories. Portfolio weightings are assigned to domestic large-cap, mid-cap and small-cap stocks as well as international developed and emerging market stocks. Simply using this framework narrows down the list of potential stocks to consider.
Individual Investor Show: Closed-End Funds, Selecting Stocks With PRISM, Hot Sector ETFs
Hypothetical couple Frank and Sue supplement the funds held in their 401(k) plans and IRAs with individual stocks. Taking a bird’s eye view of the couple’s portfolio across accounts, Frank determines they are underweighted to small-cap stocks relative to their targeted allocation.
Frank uses this information to purposely focus on small caps when researching individual stocks. He deliberately ignores other stocks because they are mismatched to his portfolio’s needs. Frank is making the conscious choice to narrow his scope of focus in order to adhere to the couple’s long-term wealth-building plan.
If Frank and Sue only held individual stocks, the process for narrowing down stocks wouldn’t change much. They would still use their allocation needs as a guide for which category of stocks to look at.
It is not uncommon for investors to look at stocks through the lens of style instead of size. Investment styles include—but are not limited to—growth, value, income and momentum. Studies have linked a preference for a particular investment style to personality traits, biology, life experiences and investment knowledge.
Having a strong preference for a particular investment style fits well within the PRISM Wealth-Building Process. As part of Step 4 of the PRISM Wealth-Building Process—selecting and managing your investments—it’s important to clearly state such preferences. Doing so will help to narrow down both the types of stocks you will consider and the rules you will establish for determining when to buy or sell.
Investing preferences are a filter to be used after allocation needs are determined. You first narrow the universe of stocks down to the asset class group matching your allocation needs and then you apply your style preferences.
Our hypothetical couple Frank and Sue have developed a preference for the value investment style. This preference is based on the long-term outperformance of value stocks.
In searching for small-cap stocks to fill the couple’s allocation needs, Frank looks specifically at small-cap value stocks. This combines their allocation need (small-cap stocks) with their style preference (value).
Value investors seek stocks trading at discounted valuations. The premise of value investing is to pay less than a dollar for something worth a dollar.
Several metrics are now used to determine a stock’s valuation. They include the price-to-book, price-to-sales, price-earnings, price-to-cash flow and enterprise-value-to-EBITDA (earnings before interest, taxes, depreciation and amortization) ratios.
Value investors utilize these metrics either on an absolute or relative basis.
An absolute basis sets a firm number above which the stock will not be bought, and a second level at which it will be sold. AAII’s Model Shadow Stock Portfolio uses a form of absolute ratios. Micro-cap stocks must have a price-to-book ratio no higher than 1.10 and a price-to-sales ratio no higher than 1.20 to be considered as candidates.
Absolute valuation ratios do not have to be set in stone. They can evolve over time if set to a measurable quantitative metric. The current price-to-book ratio ceiling of 1.10 for the Model Shadow Stock Portfolio is based on the valuation of the “cheapest” 10% of domestic companies listed on the New York Stock Exchange (NYSE). This ratio is periodically revised up or down to reflect prevailing market conditions. (The portfolio’s valuation sell rule is simply three times the maximum price-to-book ratio for purchasing stocks.)
Relative valuations compare a stock’s current valuation to another metric. The metric can be the valuations of other stocks, the market’s valuation or the valuation range that a stock has previously traded within. The Model Shadow Stock Portfolio’s valuation rules are based on a relative indicator (the cheapest 10% of NYSE-listed stocks).
Many AAII stock screens use relative valuation metrics. The Joseph Piotroski screen seeks out stocks with price-to-book ratios ranking in the cheapest 20% of all stocks. Industry metrics are used for the AAII Josef Lakonishok screen. A stock must have a price-earnings ratio, price-to-book-value ratio, price-to-cash-flow ratio, or a price-to-sales ratio lower than the respective industry median value to qualify.
It is possible to combine relative and absolute metrics. AAII’s David Dreman screen uses a relative valuation metric for price-earnings ratios of the cheapest 40% of all stocks and an absolute valuation metric of a dividend yield greater than 1.5%.
The valuation ratios listed below show the breakpoints for what is cheap and what is expensive as of the time of publication.
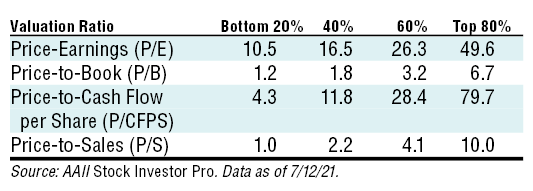
In all cases, the rules for selling are the opposite of the rules for buying. Sell a low-value stock when it is either no longer heavily discounted (if favoring deep value) or expensive (if favoring value).
Growth investors seek stocks primarily with rising sales and/or earnings. Higher sales and earnings can justify higher valuations and therefore higher share prices.
Growth metrics can be backward- or forward-looking. Backward-looking metrics include historical sales and historical earnings. Projected earnings are the forward-looking metric most widely available to individual investors.
Just like value, growth metrics can be used on an absolute or a relative basis.
Absolute growth metrics require a minimum rate of increases. AAII’s John Neff screen requires companies to have a five-year sales growth rate of between 7% and 20%. (Neff’s logic for using an upper limit is to exclude those companies whose rate of growth is too high to be sustainable.)
Relative growth is what AAII’s William O’Neil CAN SLIM screen uses. The CAN SLIM Revised 3rd Edition screen seeks a trend of quarter-over-quarter and year-over-year growth in historical earnings. Notably, it also includes an absolute component by requiring a three-year annualized growth rate of 25% in earnings.
The growth rate of one company can also be compared to the growth rates of other companies. Relative year-over-year and five-year growth rates for sales, earnings and operating cash flow can tell you if growth is strong or weak.
Growth stocks are candidates to be sold if sales or earnings are falling instead of growing. They may also be candidates for selling if growth falls below a certain level. An investor desiring strong growth may consider parting with a stock if its current or projected growth rate falls to a mid- or low-single-digit percentage, for instance. Those wishing to reduce the number of transactions may want to add allowances for business and economic cyclicality—such as considering both short-term and long-term growth rates.
Current growth rates—from low to high as of the time of publication—are listed below.
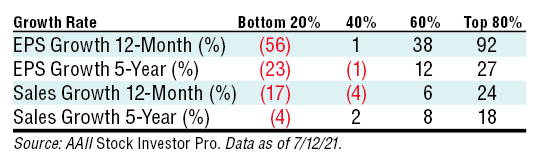
Some investors combine growth and value metrics, a concept known as growth at a reasonable price, or GARP. The AAII Stock Market Winners screen requires a low price-to-book ratio and two quarters of earnings growth.
Dividends are favored by many investors as a source of portfolio income or a sign of underlying fundamental strength.
There are two primary camps of dividend investors. One prefers higher yields. The other prefers growth. In both cases, absolute and relative measures can be used.
Higher yields signal a larger dividend being paid relative to the price of the stock. Investors can also use higher yields to seek out stocks with cheaper valuations. The Dogs of the Dow screen seeks out the 10 stocks that have the highest yield within the 30 stocks of the Dow Jones industrial average (a relative measure).
Dividend growth strategies, on the other hand, seek a pattern of rising dividends. These are companies that are expected to continue growing their dividend in the future. AAII’s High Relative Dividend Yield screen requires companies to have increased their dividends over each of the past six fiscal years (an absolute measure).
A relatively higher yield can be combined with dividend growth. AAII’s Geraldine Weiss Blue Chip Dividend Yield screen requires that a stock’s current yield be within 10% of its seven-year average high. It also requires the dividend to have been raised at least three times over the past seven years.
Here are metrics for dividend growth and yield as of the time of publication. The numbers are skewed because only one-third of publicly traded companies pay a dividend.
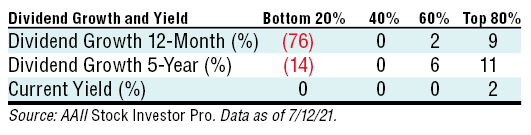
A common rule is to sell a stock when its dividend has been cut or suspended. A drop in a stock’s yield below its historical average low or a certain percentage below the market’s yield are other sell rules that can be used.
Momentum investors seek outperforming stocks.
Relative momentum strategies seek stocks that have outperformed over a certain period. AAII’s Value on Move—PEG With Estimated Growth screen requires passing stocks to have outperformed at least 70% of stocks over the past 26 weeks.
Absolute momentum screens look at a stock’s individual price performance. The Driehaus Revised screen requires passing stocks to have risen in price over the past four weeks. The O’Neil CAN SLIM Revised 3rd Edition screen seeks stocks trading within 90% of their 52-week highs.
Momentum strategies sell stocks when their relative price strength has weakened. Because momentum is likely to change quicker than value or growth, allowances should be made by those who desire to reduce the number of transactions. Where you set the number depends on your preference for fewer versus more transactions. Price performance tends to weaken the most for stocks with the weakest levels of relative strength. O’Neil—whose CAN SLIM system is associated with more frequent transactions—has suggested a much higher relative strength rank. Essentially, any stock whose relative strength is nearing average levels (60% or lower) should be removed.
Absolute levels of price return do not translate into a specific level of relative price strength that an investor can consistently seek out because of varying market conditions. (This is why no table is shown here.) Rather, momentum investors should consider relative price strength rankings of 60% or higher as a buy rule. Portfolios composed of stocks with relative price strength rankings in the bottom third—and particularly the bottom 20%—have historically continued to underperform.
Momentum indicators can be combined with other styles. Momentum has been shown to work particularly well with value. (See the discussion with Jack Vogel about factors in this issue for more on combining momentum and value.)
Beyond the aforementioned styles, there are other preferences and constraints an investor may have.
Trading activity is one. Investors who prefer to transact less often should consider strategies with less frequent turnover. These are often tied more to a company’s underlying fundamentals, such as value and income approaches. Strategies incorporating momentum or technical analysis (charting) are associated with comparatively higher levels of turnover.
Taxes are a related consideration. A higher number of transactions increases the odds of realizing a short-term capital gain in a taxable account. Such gains are taxed at ordinary income rates. Long-term capital gains and qualified dividend income both qualify for reduced tax rates.
A stock’s liquidity—the ability to buy or sell easily at quoted prices—can be a concern for investors with large portfolios or the desire to execute trades in a quick fashion. Such investors may consider opting for larger companies. Small-cap value stocks can provide more potential upside for those investors who are comfortable purchasing stocks with comparatively much lower levels of volume.
Sustainable investing strategies—including environmental, social and governance (ESG)—will reduce the universe of stocks to choose from. So will other values-based approaches, such as those based on religious values. If such approaches matter to you, be sure include them in your rules.
Preferences for styles, strategies and types of stocks vary by investor. There is no single strategy that makes sense for every investor. When writing down your approach for buying and selling stocks, think about your personal preferences. Doing so will help you narrow down the large universe of stocks to those most likely to be appealing to you.
We think you’d like this related webinar! Creating Your Own Personalized Wealth Plan With PRISM
AAII Stock Ideas

Stock Strategies


No comments have been added yet. Add your thoughts to the discussion!
You need to log in as a registered AAII user before commenting.
Log InCreate an account