


Related

AAII Model Portfolios
The first-quarter review resulted in changes to the price-to-book and market-cap maximums. Plus, four holdings met the sell rules, making way for three new additions.
by John Bajkowski | April 2022

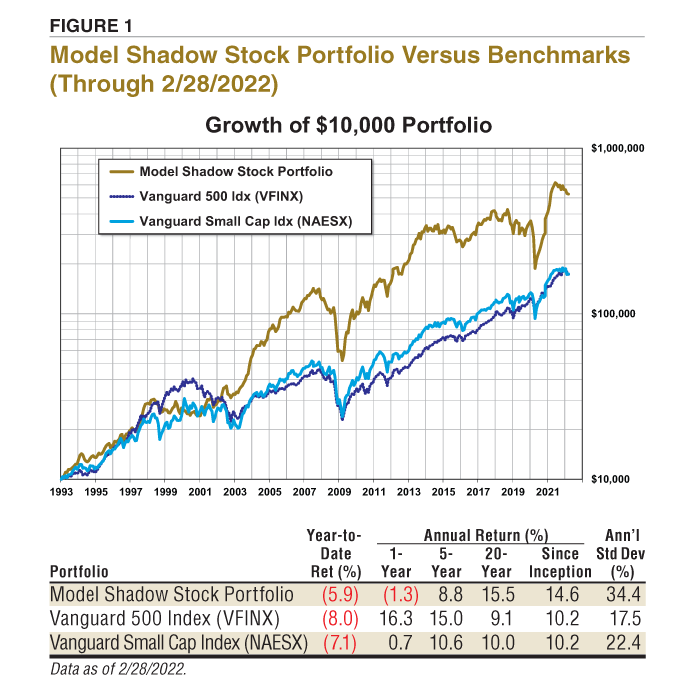
Small-cap and value holdings held up better in February than the broad market. The Model Shadow Stock Portfolio lost 1.0% during February 2022 and is now down 5.9% for the year. The S&P 500 index as measured by the performance of the Vanguard S&P 500 Index fund  (VFINX) had a loss of 3.0% during February and is down 8.0% for the first two months of the year. The Vanguard Small Cap Index fund (NAESX) is down 7.1% for the year after gaining 0.8% in February.
Value stocks outperformed growth stocks during February across all size segments, and value stocks are outperforming growth stocks for the first two months of 2022.
Since its inception in 1993, the AAII Model Shadow Stock Portfolio has a compound annual average return of 14.6% versus the Vanguard 500 Index fund’s gain of 10.2% per year on average over the same period. Over the same period, the Vanguard Small Cap Index fund also posted an average annual gain of 10.2%.
The quarterly review begins with an examination of the breakpoints for the smallest and cheapest deciles of domestically listed stocks. The primary Model Shadow Stock Portfolio selection criteria target the intersection of the smallest 10% of domestic stocks as measured by market capitalization, along with the “cheapest” 10% of domestic stocks as measured by the price-to-book-value (P/B) ratio. These decile breakpoints are determined by examining domestic companies that are listed on the New York Stock Exchange (NYSE) and then applying the size and value breakpoints for stocks listed on all domestic exchanges.
We used AAII’s Stock Investor Pro to examine the decile maximums and also examined the breakpoints maintained by Dartmouth College professor Kenneth R. French. The market weakness since our last review in November 2021 pushed down our decile breakpoints. When the quarterly review was conducted at the start of March, the price-to-book cutoff for the lowest decile had decreased to 0.90, 18% below the model portfolio’s maximum initial price-to-book ratio of 1.10. Therefore, the maximum minimum initial price-to-book ratio is being reduced from 1.10 to 0.90. Stocks are sold for valuation if they exceed three times the minimum initial price-to-book ratio at the time of a quarterly portfolio review. We used a price-to-book cutoff of 0.90 to screen for stocks to add to the Model Shadow Stock Portfolio and 2.70 (0.90 (KTCC) 3) as the maximum price-to-book ratio to keep stocks in the portfolio.
The market-cap cutoff for the lowest decile is currently $429 million, compared to the $479 million maximum in November, so the size cutoff was also adjusted for the Model Shadow Stock Portfolio during the quarterly review from $500 million to $400 million. The maximum market cap for inclusion in the Model Shadow Stock Portfolio is now $400 million, and holdings are sold if their market cap goes above three times the initial criterion at the time of the quarterly review: $1.2 billion.
We also eliminated the maximum price-to-sales cutoff used to screen for inclusion in the Model Shadow Stock Portfolio. The price-to-sales filter was first added as a screening filter for the model portfolio based upon the work of James O’Shaughnessy, who found that the price-to-sales ratio was an effective measure to locate value stocks. O’Shaughnessy published separate growth and value approaches in the influential book, “What Works on Wall Street” (McGraw Hill, 2011). More recent editions of the book note the advantages of using composite factors to identify promising candidates and have moved beyond the price-to-sales ratio. (See “‘What Works’: Key New Findings on Stock Selection” by James O’Shaughnessy in the October 2013 AAII Journal.)
The price-to-sales filter has never been a primary valuation factor for the model portfolio, used only to help determine qualifying stocks and not used to remove stocks from the portfolio. Its removal from determining the initially qualifying list of companies will not dramatically change the number passing but will allow a slightly broader consideration in certain higher profit margin industries that traditionally trade with higher price-to-sales ratios.
The other major factor that leads to portfolio turnover is tied to negative earnings. If a company reports trailing 12-month earnings from continuing operations that are negative, the stock is placed on probation; if a subsequent quarter has negative earnings prior to trailing 12-month earnings becoming positive, the stock is sold.
The detailed Model Shadow Stock Portfolio purchase and sell rules, along with portfolio management tips, are available here.
After conducting the quarterly review of the Model Shadow Stock Portfolio, Orion Group Holdings Inc. (ORN), Ranger Oil Corp. (ROCC), Rayonier Advanced Materials Inc. (RYAM) and SIFCO Industries Inc. (SIF) were removed from the tracking portfolio during regular trading hours on Monday, March 14, 2022.
With the proceeds from these four sales, as well as the cash held in the portfolio, there were only enough funds to purchase three new holdings at the average portfolio holding size—Advanced Emissions Solutions Inc. (ADES), Fonar Corp. (FONR) and SigmaTron International Inc. (SGMA).
TABLE 1. First-Quarter 2022 Transactions
At the time of our quarterly review, Ranger Oil exceeded the market-cap sell cutoff of $1.2 billion with a market cap of $1.64 billion. It is the policy of the Model Shadow Stock Portfolio to sell a stock once its market cap reaches three times the initial purchase limit, which is now $400 million.
Ranger Oil, formerly Penn Virginia Corp., is an independent oil and gas company. It’s engaged in the development and production of oil, natural gas liquids (NGLs) and natural gas, with operations in the Eagle Ford shale in South Texas.
(ORN)Orion Group Holdings is a specialty construction company, which serves the infrastructure, industrial and building sectors, providing services both on and off the water in the continental U.S., Alaska, Canada and the Caribbean Basin.
Orion Group is being removed from the portfolio because of the Model Shadow Stock Portfolio’s negative earnings rule. On March 2, 2022, the company reported an adjusted quarterly loss of $0.17 per share, while trailing 12-month earnings remained negative. Adjusted trailing 12-month earnings per share first turned negative on October 27, 2021, when the company reported a loss of $0.27 per share on adjusted third-quarter earnings.
(RYAM)Rayonier Advanced Materials is a cellulose-based technology company whose products are used in the production liquid-crystal display (LCD) displays, filters, fibers, performance additives for pharmaceutical, food and other industrial applications. It also manufactures products for paperboard and high-yield pulp markets.
Rayonier Advanced Materials is being removed from the portfolio because of the Model Shadow Stock Portfolio’s negative earnings rule. On February 23, 2022, the company reported an adjusted quarterly loss of $0.37 per share, while trailing 12-month earnings remained negative. Adjusted trailing 12-month earnings per share first turned negative on November 2, 2021, when the company reported a loss of $0.21 per share on adjusted third-quarter earnings.
(SIF)SIFCO Industries is a worldwide provider of highly engineered forged components to the aerospace, energy and defense markets.
SIFCO is being removed from the portfolio because of the Model Shadow Stock Portfolio’s negative earnings rule. On February 23, 2022, the company reported a quarterly loss of $0.636 per share, while trailing 12-month earnings remained negative. Adjusted trailing 12-month earnings per share first turned negative last quarter, when the company reported a loss of $0.43 per share on third-quarter earnings.
As of March 11, 21 stocks met the initial selection criteria for the Model Shadow Stock Portfolio. This is down from 36 passing companies last month; however, last month the price-to-book maximum was 1.10 and the market-cap ceiling was $500 million. Using the old cutoffs, 40 companies passed the initial selection criteria. AAII members can see and research which companies are currently passing the initial selection criteria in the Shadow Stock Ideas table online at the Shadow Stocks area. The list of new Shadow Stock Ideas is updated daily—Tuesday through Saturday.
Two stocks already in the Model Shadow Stock Portfolio passed the updated criteria at the time of the review: Key Tronic Corp. (KTCC) and Strattec Security Corp. (STRT).
The remaining 19 stocks were examined to ensure adequate liquidity, timely financial filings and appropriate industry and foreign considerations. Seven stocks were excluded from consideration because their average daily dollar trading volume was too low, indicating that they might be difficult to purchase without severely impacting the share price. The Shadow Stock Portfolio Rules on
AAII.com provide guidance for factors to consider when selecting stocks for your portfolio.
Price momentum is used as the tie breaker among qualifying stocks. The remaining stocks were ranked using the weighted relative strength ranking, which considers price performance over the last year but places a higher weight on the most recent quarterly price performance.
Three holdings were added using the average position size of the remaining holdings: Advanced Emissions Solutions, Fonar and SigmaTron International.
Advanced Emissions Solutions is engaged in the sale of consumable air and water treatment options, including activated carbon and chemical technologies. The firm’s segments include refined coal (RC) and advanced purification technologies (APT).
Advanced Emissions Solutions has a book value per share of $8.05 as of December 31, 2021. If you wish to stay within the 0.90 price-to-book maximum, you should pay no more than $7.25 per share ($8.05 (KTCC) 0.90). However, if the stock price has moved up after being added to the portfolio, you can still purchase the stock unless the price-to-book ratio goes above 1.00, which equates to a price of $8.05 per share. To calculate the maximum purchase price based on the maximum desired price-to-book ratio, multiply the current book value per share ($8.05 for Advanced Emissions Solutions) by the maximum price-to-book ratio to be considered for the Model Shadow Stock Portfolio (currently 0.90, or 1.00 for loosened consideration).
Fonar is engaged in the research, development, production and marketing of magnetic resonance imaging (MRI) scanners for the detection and diagnosis of human diseases in the U.S.
Fonar has a book value per share of $21.01 as of December 31, 2021. If you wish to stay within the 0.90 price-to-book maximum, you should pay no more than $18.91 per share ($21.01 (KTCC) 0.90). However, if the stock price has moved up after being added to the portfolio, you can still purchase the stock unless the price-to-book ratio goes above 1.00, which equates to a price of $21.01 per share.
SigmaTron International is a provider of electronic manufacturing service (EMS), which includes printed circuit board assemblies and completely assembled box-build electronic products to customers. SigmaTron is a former holding within the Model Shadow Stock Portfolio. It was removed from the portfolio on December 3, 2018, when it violated the portfolio’s positive earnings rules.
SigmaTron has a book value per share of $16.95 as of October 31, 2021. If you wish to stay within the 0.90 price-to-book maximum, you should pay no more than $15.26 per share ($16.95 (KTCC) 0.90). However, if the stock price has moved up after being added to the portfolio, you can still purchase the stock unless the price-to-book ratio goes above 1.00, which equates to a price of $16.95 per share.
TABLE 2. Model Shadow Stock Portfolio
The next quarterly review of the Model Shadow Stock Portfolio will take place following the end of May 2022. In the meantime, you can follow the portfolio in the Shadow Stocks area on AAII.com. To receive monthly email updates along with alerts to any changes made to the portfolio, please sign up at www.aaii.com/email.
We think you’d like this related webinar! AAII Shadow Stock Portfolio: From Theory to Practical Application
AAII Model Portfolios

AAII Model Portfolios
Stock Strategies

WILLIAM C from CA posted over 4 years ago:
Douglas K from USA posted over 4 years ago:
You need to log in as a registered AAII user before commenting.
Log InCreate an account