


Related

AAII Model Portfolios
Examining year-by-year results gives a better picture of volatility and performance over the long term than any one month’s advance or decline.
The coronavirus pandemic laid waste to expectations for the world to smoothly return to something resembling a pre-pandemic way of life this year. It feels that every time we start to see the impact of coronavirus cases declining, we are introduced to a new variant of concern that makes the market pause and reevaluate the situation. Many of us first heard about the ominous sounding omicron variant on Thanksgiving, dampening the prospect of the pandemic’s impact becoming a thing of past. Initial reports held that omicron had the possibility of being more contagious than the alpha, beta, gamma or delta variants that had already contributed to the deaths of over five million people worldwide. While it is likely that the coronavirus pandemic has changed the work environment permanently for many, the prospect of continued worldwide travel restrictions, uncertainty over the long-term effectiveness of vaccinations and cumulative impact of the fatigue from dealing with the pandemic without any certain end point have become chilling concerns.
The market’s reaction continues to be swift and sharp as it oscillates between a risk-on and risk-off state of mind. The discovery of the omicron variant during November helped fuel a broad market decline, with the S&P 500 index down by 4.0% over the course of four trading days after Thanksgiving.
The S&P 500 was down 0.7% during November, which does not seem very significant, but the breadth of the index has been weakening. The S&P 500 ended the month down only 3.7% from its 52-week high, but 23% of the companies that make up the index were down 20% or more from their 52-week high. The proportion of stocks experiencing a bearish decline is greater as you examine smaller firms. In the S&P MidCap 400 index, 36.8% of the constituents were down 20% or more at the end of November and 50.5% of the stocks in the S&P SmallCap 600 were down at least 20% from their 52-week high. Gains of the market-cap-weighted S&P 500 can sometimes mask the rotation that is within the many sectors of the marketplace.
Large-cap growth stocks actually posted a 1.4% gain during November, building up their year-to-date gain to 28.8%. Large-cap value stocks lost 3.3% during the month, trimming their gain for the year to 16.7% through the end of November.
The outperformance of the large-cap growth segment was fueled by the strong performance of the technology segment. Only two sectors posted gains during November: technology and consumer discretionary. The technology sector was up 4.4% during the month, while the consumer discretionary sector gained 1.7% during November. Communications services was the weakest sector during the month with a 6.1% loss followed by financials (down 5.7%) and energy (down 5.1%). Even with the large decline during November, the energy sector has the strongest gain for the first 11 months of 2021, up 48.9%, followed by real estate (up 32.6%) and financials (up 30.7%). Sectors that were lagging this year through November include consumer staples (up 6.1%), utilities (up 7.3%) and communications services (up 12.4%).
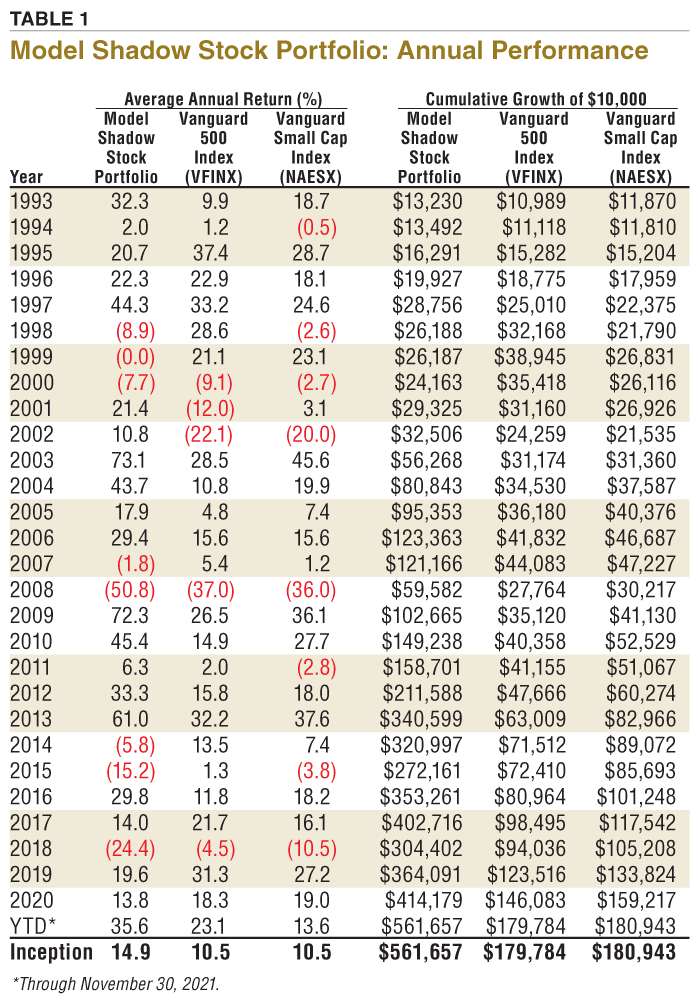
The Model Shadow Stock Portfolio lost 5.3% during the month, reducing its year-to-date gain to 35.6%. The S&P 500 as measured by the Vanguard 500 Index fund  (VFINX) lost 0.7% during November and is now up 23.1% for the year. The Vanguard Small Cap Index fund (NAESX) lost 4.3% in November and is up 13.6% year to date.
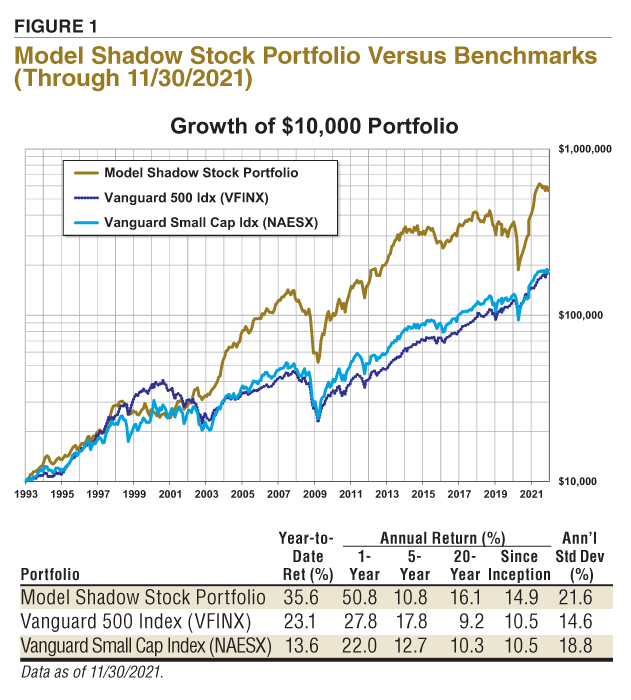
Since its inception in 1993, the AAII Model Shadow Stock Portfolio has a compound annual average return of 14.9% versus the Vanguard 500 Index fund’s gain of 10.5% per year on average over the same period. Over the same period, the Vanguard Small Cap Index fund also posted an average annual gain of 10.5%. Figure 1 shows performance over longer periods.
Table 1 provides the year-by-year performance of the Model Shadow Stock Portfolio and some comparison benchmarks. The annual performance helps to provide a better indication of the variability and performance over time. The long-term performance of the Model Shadow Stock Portfolio has been strong, but it is also accompanied by larger year-to-year swings in performance and periods of underperformance. The Model Shadow Stock Portfolio’s volatility as measured by its standard deviation has been 21.6% annualized since inception, compared to 14.6% for the Vanguard 500 Index fund and 18.8% for the Vanguard Small Cap Index fund.
Table 2 shows the companies that currently make up the Model Shadow Stock Portfolio.
The primary selection criteria target the intersection of the smallest 10% of domestic stocks as measured by market capitalization and the “cheapest” 10% of domestic stocks as measured by the price-to-book-value (P/B) ratio. These decile breakpoints are determined by examining domestic companies that are listed on the New York Stock Exchange (NYSE) and change over time.
We used AAII’s Stock Investor Pro to examine the decile maximums and are leaving them unchanged. The NYSE price-to-book cutoff was 1.04 on December 10, 2021, down from 1.06 in August, not significant enough to warrant a revision to the portfolio rules. The highest minimum initial price-to-book ratio for determining qualifying stocks remains at 1.10. Stocks are sold for valuation if they exceed three times the minimum initial price-to-book ratio at the time of a quarterly portfolio review. A price-to-book cutoff of 1.10 is used to screen for stocks to add to the Model Shadow Stock Portfolio and 3.30 (1.10 (BSET) 3) is the maximum price-to-book ratio to keep stocks in the portfolio.
As of December 10, 2021, Perion Network Ltd. (PERI) had the highest price-to-book ratio in the Model Shadow Stock Portfolio. While its ratio of 2.84 is approaching the value limit for the portfolio, it is below the 3.30 level used to remove a security due to valuation. Perion Network is an Israel-based global technology company that delivers online advertising solutions and search monetization to brands and publishers. Perion Network was down 15.0% during November but was still up 89.7% year to date through the end of November.
The NYSE market-cap cutoff for the lowest decile was $479 million at the time of review, compared to $460 million in August. Here again the size change was not significant enough merit an adjustment to the portfolio rules. The highest minimum initial market cap for determining qualifying stocks remains at $500 million. Stocks are sold for valuation if they exceed three times the minimum initial market cap at the time of a quarterly portfolio review. A market-cap cutoff of $500 million is used to screen for stocks to add to the Model Shadow Stock Portfolio and $1.5 billion ($500 million (BSET) 3) is the maximum market cap to keep stocks in the portfolio.
TABLE 2. Model Shadow Stock Portfolio
Ranger Oil Corp. (ROCC) has the highest market-cap in the Model Shadow Stock Portfolio with a value of $1.26 billion as of December 10. Ranger Oil, formerly Penn Virginia Corp., is an independent oil and gas company. The company is engaged in the development and production of oil, natural gas liquids (NGLs) and natural gas, with operations in the Eagle Ford shale in South Texas. Ranger Oil’s market is approaching the size limit for the portfolio but was below the $1.5 billion maximum level currently used to manage the portfolio.
Thirty-five stocks met the initial selection criteria for the Model Shadow Stock Portfolio as of December 10, 2021, up from 26 passing stocks one month ago. AAII members can see and research which companies are currently passing the initial selection criteria in the Shadow Stock Ideas table on AAII.com. The list of Shadow Stock Ideas is updated daily—Tuesday through Saturday.
Of the 35 qualifying companies, six are currently held in the Model Shadow Stock tracking portfolio: Bassett Furniture Industries Inc. (BSET), Hurco Companies Inc. (HURC), Key Tronic Corp. (KTCC), Mesa Air Group (MESA), Strattec Security Corp. (STRT) and VOXX International Corp (VOXX).
Bassett Furniture Industries is a holding recently added to the list of qualifying stocks and operates in the home furnishing industry. It last qualified on November 29, 2019.
Pangaea Logistics Solutions Ltd. (PANL) came off the list of qualifying stocks when its share price fell below $4.00 per share. Pangaea Logistics provides seaborne dry bulk logistics and transportation services.
SIFCO Industries Inc. (SIF) came off the list of qualifying stocks when it reported negative quarterly earnings that also pushed its trailing 12-month earnings per share into the red. SIFCO Industries is engaged in the production of forgings and machined components primarily for the aerospace and energy markets. The processes and services include forging, heat-treating, coating and machining. Its results were hurt by continued logistics and operational issues related to the coronavirus pandemic.
The other major factor that leads to portfolio turnover is tied to negative earnings. If a company reports trailing 12-month earnings from continuing operations that are negative, the stock is placed on probation; if a subsequent quarter has negative earnings prior to trailing 12-month earnings becoming positive, the stock is sold. When available, adjusted (non-GAAP) earnings are used to put stocks on probation or sell them. These are earnings that have been adjusted to eliminate the impact of nonrecurring events such as markdown of inventory or goodwill. These are earnings reported in the media and firms reporting consensus estimates. The I/B/E/S adjusted earnings reported in Stock Investor Pro are used for Model Shadow Stock Portfolio decisions when they are available. These profitability rules act as a basic quality measure to help filter out the many weak companies found amid the pool of stocks trading with low price-to-book ratios.
Three stocks were placed on earnings probation this past quarter: Orion Group Holdings Inc. (ORN), Rayonier Advanced Materials Inc. (RYAM) and SIFCO Industries. These companies will remain on probation until their trailing 12-month earnings from continuing operations turn positive and they will be removed from the portfolio if they report negative earnings while still on probation.
Upon completion of our quarterly review, no stocks met the quantitative valuation, size or earnings quality sell rules.
The next quarterly review takes place after the end of February 2022. Any changes to the portfolio are reported at the time they are made in our Model Shadow Stock Portfolio Update emails (sign up at www.aaii.com/email).
We think you’d like this related webinar! Individual Investor Show: Two Easy Ways to Take Control of Your Stock Investing
AAII Model Portfolios
AAII Model Portfolios
AAII Model Portfolios

No comments have been added yet. Add your thoughts to the discussion!
You need to log in as a registered AAII user before commenting.
Log InCreate an account