On a relative valuation basis, small-cap stocks remain cheaper than usual.
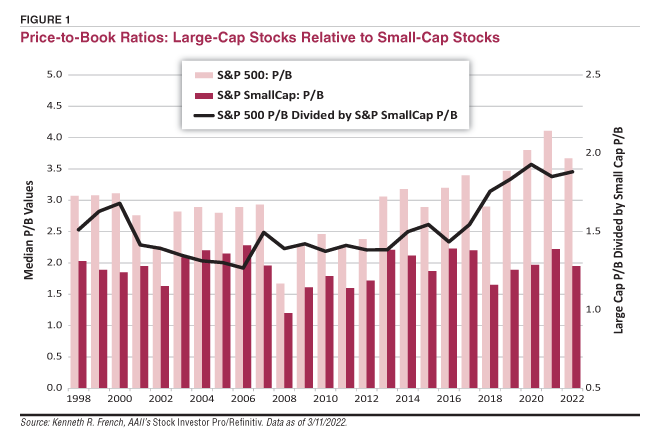
The chart here compares the price-to-book-value (P/B) ratio of S&P SmallCap 600 index stocks to the price-to-book ratio of S&P 500 index large-cap stocks. As of mid-March 2022, the median price-to-book ratio for S&P SmallCap 600 stocks was 1.95. For S&P 500 stocks, the median price-to-book ratio was 3.67. Dividing 3.67 by 1.95 gives us a relative price-to-book valuation of 1.88.
Larger numbers reflect higher valuations for large-cap stocks relative to small-cap stocks. To put the current number into perspective, the average relative price-to-book ratio is 1.52. The relative price-to-book ratio reached 2.12 in April 2020, as we noted in the Model Shadow Stock Portfolio commentary published in the May 2020 AAII Journal.
The black line on the chart plots the trend in relative valuations. As you can see, it began an upward trend in 2016 and has stayed at an elevated level since 2020.
Also plotted in the chart are absolute valuations. The large-cap values are represented by the pink bars, while small-cap values are displayed by the red bars. The current median price-to-book ratio for S&P SmallCap 600 stocks of 1.95 is nearly equal to the historical average based on data going back to 1988. The low of 1.20 occurred at the end of 2008 during the financial crisis. The current median price-to-book ratio for S&P 500 stocks of 3.67 is above the historical average of 2.93. It is down from 2021’s high of 4.11.
The large differential in valuations favors small-cap stocks over large-cap stocks. (Though not shown in the chart, the relative price-earnings and the price-to-sales valuations also show large-cap stocks commanding a larger-than-unusual premium compared to small-cap stocks.) Should relative valuations revert to mean (average) levels, then small-cap stocks would outperform large-cap stocks. Of course, this assumes that the relationship between small-cap and large-cap stock valuations has not permanently changed.







ROBERT A from NC posted over 4 years ago:
ZACHARIAH T from NH posted over 4 years ago:
You need to log in as a registered AAII user before commenting.
Log InCreate an account