



Featured Tickers:
Almost all approaches to investing are concerned with risk, which practically speaking is the likelihood that your investment will be worth less at the end of your holding period than it was at the time it was originally invested.
Because so much investment risk is tied to the perception of the individual investments and the total market, investor sentiment is closely tracked. Many try to gauge the pattern of the fluctuating economic animal spirits to put themselves in an advantageous investment position.
To this end, one of the measurements investors use to gauge market sentiment is the put-call ratio. Options traders buy put options if they anticipate a decline in prices. A put option guarantees a minimum selling price even if a stock’s current price is below the option contract’s strike price. Conversely, a call option guarantees a maximum purchase price even if a stock’s current price is above the option contract’s strike price. Thus, options traders buy call options if they think prices will rise in the future.
A put-call ratio of 1.0 indicates that the volume of call contracts is the same as the volume of put contracts. When the put-call ratio is greater than 1.0, the volume in put contracts exceeds the volume in call contracts. This is typically an indication of bearish sentiment (market may be turning down). Conversely, a put-call ratio of less than 1.0 is typically an indication of bullish sentiment (market may be turning up). Interest—the number of put and call contracts outstanding—is sometimes used instead of volume to calculate the ratio.
Since the stock market has historically risen more often than fallen, an average put-call ratio of around 0.7 (meaning more volume in calls than puts) is considered to be a sign of relatively neutral sentiment. Put-call ratios above 0.7, and particularly above 1.0, signal higher levels of pessimism. A put-call ratio below 0.7 is a sign of traders being optimistic about the direction of stock prices.
The Chicago Board Options Exchange (CBOE) provides daily market statistics related to the options market, including an overall put-call ratio for the market.
How to Use the Put-Call Ratio
As a measure of market sentiment, the put-call ratio can be of help to determine when the market is getting too bullish or bearish. This is desirable for contrarian investors, who work to advantageously place themselves against the current emotionally driven direction of the market. In a recession, a contrarian may buy assets they believe have fallen below their fair value due to the overly pessimistic attitudes of other investors.
On either side of the sentiment spectrum, bullish and bearish extremes can be a precursor of a market reversal. When speculation in call options becomes excessive, the put-call ratio will be low. This occurs when a large proportion of traders expect prices to continue reaching new highs, such as during a bubble. When speculation in puts becomes excessive—which occurs when traders expect prices to continue falling such as during a bear market—the put-call ratio will be high.
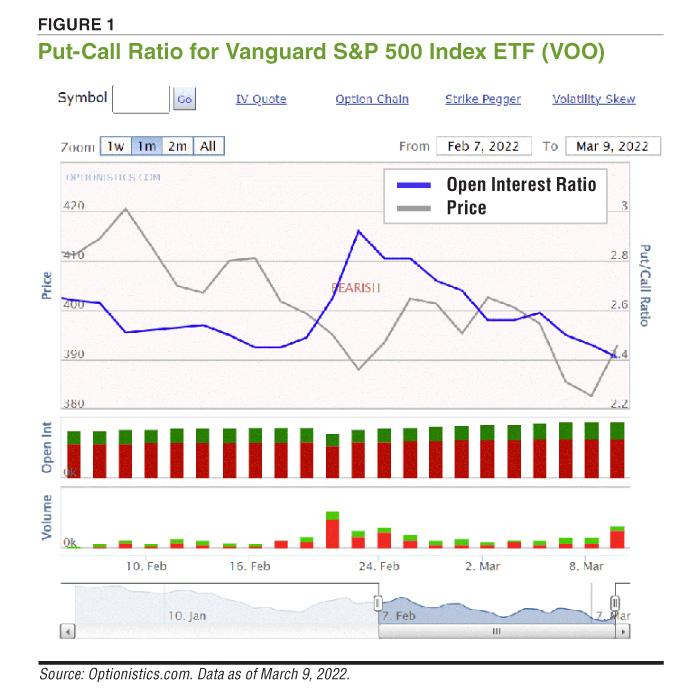
If you are interested in looking at individual stock and fund put-call ratios, Optionistics.com offers free charts. These charts show implied volatility and historical prices of the last 90 days. Figure 1 shows the put-call ratio chart for the Vanguard S&P 500 index ETF  (VOO).
Contrarians view high put-call ratios as a sign of excessive pessimism. A high put-call ratio is often a signal to see if stocks are oversold and therefore undervalued. In contrast, a low put-call ratio is often a signal to see if stocks are overbought and therefore overvalued.
Looking at the chart for the Vanguard 500 ETF, there is an obvious rise in the put-call ratio starting in late February 2022 around the time of Russia’s invasion of Ukraine. Traders fretted about the impact of the war and sought to buy puts to protect against possible losses.
We can see this in the large increase in the number of put options and the smaller-in-scale decrease in the number of call options over the first week of the invasion. The Vanguard 500 ETF’s put-call ratio hit a peak of 2.92 on February 23, 2022.
Of course, there is no single ratio that definitively indicates when the market is in a peak, trough or transition. The extremes that demarcate the ends of the put-call ratio spectrum also go through different periods of what indicates a normal range. Considering this, investors can also look at the current put-call ratio in comparison to its average over time.
For most individuals, a buy-and-hold portfolio strategy is optimal for dealing with investment risk. This means that most investors should not attempt to make changes to their portfolio based solely on measures like the put-call ratio. Most investors, including professionals, fail to correctly time the market.
Conclusion
When it comes to benchmarking investments in the short term, investor sentiment matters in ways that underlying stock fundamentals do not. For investors seeking measures of sentiment, the put-call ratio is just one to monitor. The put-call ratio shows in real-time the level of fear and greed among options traders.
Individual investors can use this ratio to determine if their sense of where the market is headed is in sync with others. Doing so can provide context. The key of course, is to recognize and acknowledge your emotions while not acting upon them.
Related

Dispatches
What Triggers Market Jumps?
Related

Portfolio Strategies
What You Can Gain From Reading the Economic Tea Leaves
Discussion
FREE REPORT

Get your free copy of our special
report analyzing the tech stocks
most likely to outperform the
market.
No comments have been added yet. Add your thoughts to the discussion!
You need to log in as a registered AAII user before commenting.
Log InCreate an account