


Related

Portfolio Strategies
The RMD is a built-in inflation adjuster that allows retirees to be more cautious in their asset allocation if they so choose.
by Craig Israelsen | June 2022

A return of inflation should not be very surprising. Every investment market (stocks, real estate, bonds, gold, etc.) goes through cycles, and so does inflation.
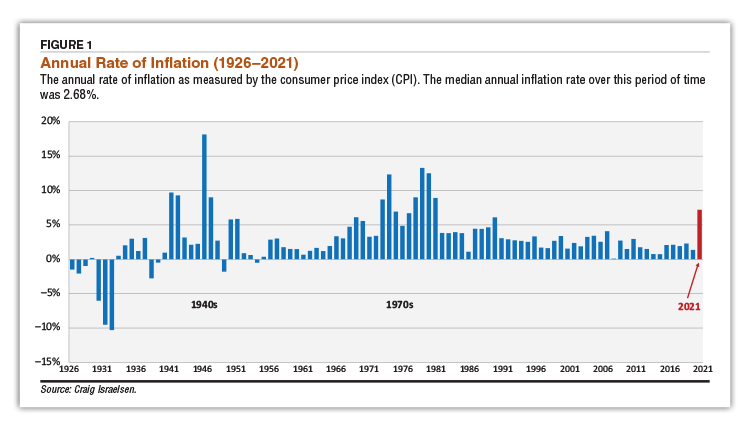
Before discussing how to deal with it, let’s start with some historical perspective on inflation. Figure 1 shows the annual rates of inflation for the past 96 years. The median annual inflation rate since 1926 has been 2.68%. The average annualized rate of inflation (geometric mean) over the past 96 years from 1926 through 2021 has been 2.90%. By either measure, inflation has been rather tame over the past 100 years. However, as the figure shows, there have been periods of markedly higher inflation, such as during the 1940s, 1970s and 1980s. From 1940 through 1949, the average annualized rate of inflation was 5.41%. During the 1970s it was 7.36%. From 1980 through 1989, inflation grew at an annualized rate of 5.10%. Since 1926, the 25-year period with the highest annualized inflation rate, 5.91%, was from 1966 through 1990.
Fast forward to 2021. Last year we saw inflation click up to 7.04% [using the consumer price index (CPI) as the indicator]. The last time CPI-based inflation was over 5% was in 1990.
Bottom line: We are now facing a cycle of inflation for an unknown length of time. The focus of this article is to demonstrate the importance of having equity investments in a retirement portfolio as a means of counteracting the impact of inflation. That is, our goal is to have withdrawals that maintain purchasing power which meets or exceeds the rate of inflation.
Here is the central question of this analysis: How often did RMD-based withdrawals meet or exceed the rate of inflation over the past 96 years? The key variable being examined is the asset allocation of the retirement portfolio. RMD stands for required minimum distribution. These are the minimum amounts the tax code requires to be withdrawn from most retirement savings accounts each year. (Roth IRAs are exempt from the RMD rules.)
Four individual asset classes were considered in this analysis: large-cap U.S. stocks, small-cap U.S. stocks, U.S. bonds and cash. In addition, using those four asset classes (indexes), five different retirement portfolios were assembled and analyzed.
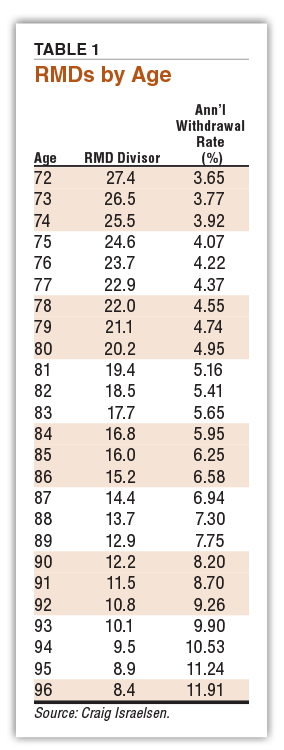
The starting balance of the retirement portfolio was assumed to be $1 million. The withdrawals over each 25-year period were determined by the RMD, based on the current RMD guidelines for a person between the ages of 72 and 96. As a percentage of the overall portfolio balance, the average RMD withdrawal between those ages is 6.60%. Only the amount of the RMD was withdrawn from the portfolio each year, no more. The RMD schedule is shown in Table 1.
Over the entire 96-year period from 1926 through 2021, there were 72 rolling 25-year periods. This approach essentially simulates 72 different retirees—each with their own 25-year period of withdrawals. The first retiree withdrew money (based on the current RMD table) in 1926 and their 25th RMD withdrawal in 1950. The second retiree started making their withdrawals in 1927, with their 25th withdrawal occurring in 1951, and so on.
By this approach, we are taking into account the impact of sequence of returns risk faced by investors—particularly retirees in the distribution phase.
Inflation was measured by using the actual annual CPI inflation rates from 1926 through 2021. I did not use 25-year CPI averages, but rather the year-to-year inflation rates as they actually occurred in each rolling 25-year period.
How did I determine if the RMD withdrawal each year kept pace with, or exceeded, inflation? The amount of the first RMD withdrawal (in the first year of each of the 72 rolling 25-year periods) was inflated by the actual rate of inflation that occurred the following year. That figure became the “hurdle” for the RMD in year 2. If the RMD in year 2 exceeded the hurdle, the RMD withdrawal kept pace with inflation. If the RMD in year 2 was less than the hurdle, the RMD failed to keep pace with inflation. This process was repeated for all 25 years in each of the 72 rolling 25-year periods.
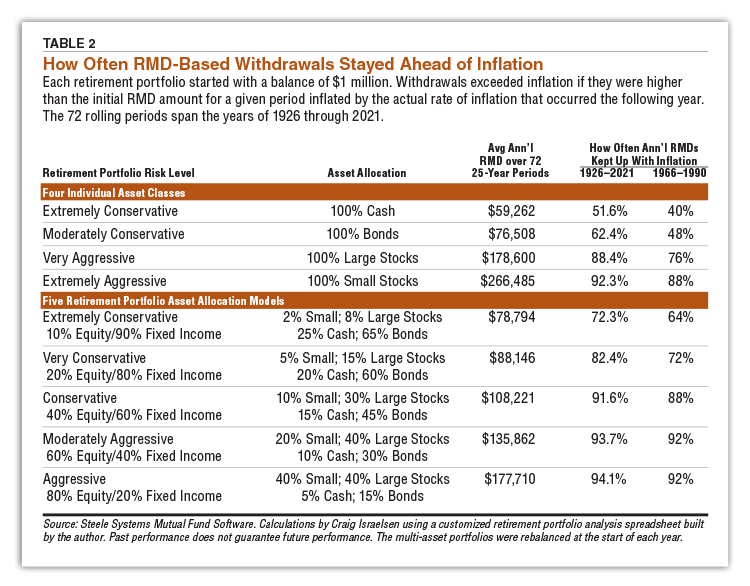
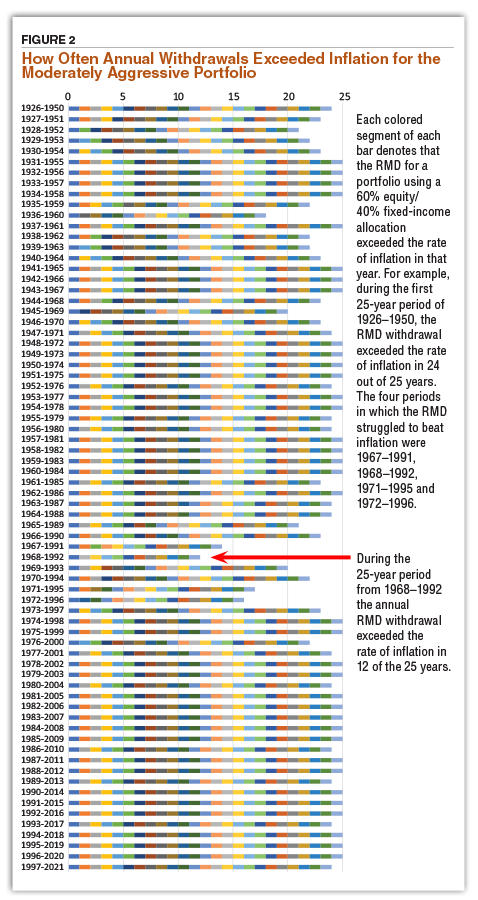
As reported in Table 2, a moderately aggressive 60% equity/40% fixed-income retirement portfolio produced RMD-based withdrawals that grew at a rate that equaled or exceeded the rate of inflation 93.7% of the time in the 72 rolling 25-year periods between 1926–2021. Figure 2 shows how that played out in each of the 72 25-year periods.
Each colored segment of each bar graph in Figure 2 denotes that the RMD withdrawal exceeded the rate of inflation in that year. Thus, during the first 25-year period from 1926 through 1950, the RMD withdrawal exceeded the rate of inflation in 24 out of 25 years. During the next 25-year period (1927 through 1951), the RMD withdrawal beat inflation in 23 out of 25 years. The four periods in which the RMD struggled to beat inflation were 1967–1991, 1968–1992, 1971–1995 and 1972–1996.
Several important observations can be drawn from the analysis results reported in Table 2.
Because the withdrawals each year are based on a percentage of the portfolio’s ending value (the methodology of the RMD) there was never a portfolio failure over any of the rolling 25-year periods. In other words, no matter what the portfolio was invested in, it never ran out of money within 25 years. Percentage-based withdrawals don’t kill portfolios. Bad investments and/or over-withdrawing are what kill a retirement portfolio.
Equity is a vital component in a retiree’s portfolio if they want to maintain purchasing power that exceeds the rate of inflation.
A 100% large-cap stock portfolio produced RMD-based withdrawals (from age 72 through 96) over the 72 rolling 25-year periods that exceeded inflation 88.4% of the time. By contrast, annual RMD withdrawals from an all-bond portfolio exceeded inflation 62.4% of the time. Annual withdrawals from a portfolio comprising 100% small stocks outpaced inflation 92.3% of the time. On the other end of the spectrum, an all-cash retirement portfolio produced withdrawals that bettered inflation just 51.6% of the time between 1926 and 2021.
If we focus on the 25-year period with the highest inflation (1966–1990), a 100% large-cap stock portfolio produced RMD withdrawals that outpaced inflation 76% of the time. An all small-cap stock portfolio bettered inflation 88% of the time. Both fixed-income asset classes (bonds and cash) produced annual withdrawals that lost purchasing power more than half the time. The annualized rate of inflation was 5.91% during this period.
Retirement portfolios consisting of only large-cap or small-cap U.S. stocks (or only bonds or cash) do not represent prudent diversified approaches, so we now transition to the analysis of the five multi-asset retirement portfolios highlighted in the lower portion of Table 2.
A 40% equity allocation is a minimal requirement for most retirement portfolios.
The most cautious of the five portfolios had an allocation of 10% equity and 90% fixed income—an extremely conservative approach. This portfolio (as with all the multi-asset portfolios) was rebalanced annually. This portfolio produced annual RMD-based withdrawals that exceeded inflation 72.3% of the time over the full 96-year time frame (and 64% of the time during the high-inflation 1966–1990 period).
If a retiree wants to maintain purchasing power at least 80% of the time, we note that a 20% equity/80% fixed-income portfolio produced RMD-based withdrawals that stayed ahead of inflation 82.4% of the time (but only 72% of the time during the 1966–1990 high-inflation period). If a retiree sets a higher bar and wants to have their annual RMD withdrawals stay ahead of inflation at least 90% of the time, an allocation of at least 40% to equities will be required.
Not surprisingly, the classic 60% equity/40% fixed-income portfolio likely represents the “sweet spot” for most retirees. It produced withdrawals that bettered inflation 93.7% of the time in 72 rolling 25-year periods from 1926 through 2021. During the inflation “crucible” from 1966 through 1990, the 25 annual withdrawals from a 60/40 portfolio bettered inflation 92% of the time.
While the RMD governs the annual withdrawals for a vast amount of retirement money, there are some accounts (Roth IRAs for example) that are not governed by the RMD. Thus, a retiree has discretion regarding how much to withdraw each year. A well-known guideline is the 4% rule (4% of the portfolio’s year-end balance is withdrawn each year). Thus, we have two common protocols for withdrawing money from a retirement portfolio: RMD and 4%.
The method of withdrawal from a retirement portfolio should inform, or at least have some bearing, on asset allocation decisions.
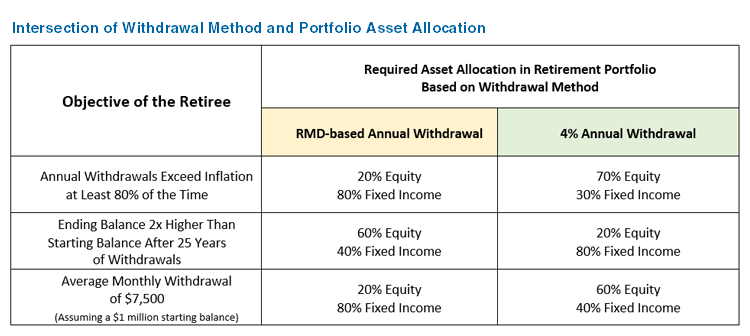
For example, if a retiree’s primary goal is to have their withdrawals keep pace with (or exceed) inflation at least 80% of the time, they will only need a 20% allocation to equities if the RMD is determining their withdrawals. If their account is not governed by the RMD and they use a 4% withdrawal rate, they will need at least 70% in equities to beat inflation roughly 80% of the time.
If the primary goal is to have an account balance two times higher than the starting balance after 25 years of withdrawals (a legacy objective), the needed equity allocation is 60% (for RMD), but only a 20% equity allocation is needed if employing a 4% annual withdrawal.
It is clear that the asset allocation of a retirement portfolio should contemplate how money will be withdrawn in combination with the most important objectives of the retiree. The table below shows the required asset allocations based on the withdrawal method used and the retiree’s objective.
For those who invest at Vanguard, funds to consider for the equity allocation portion of your portfolio may include Vanguard Growth & Income Investor  (VQNPX), Vanguard Mid-Cap Index Admiral (VIMAX), Vanguard Strategic Small-Cap Equity Investor (VSTCX), Vanguard Developed Markets Index Admiral (VTMGX) and Vanguard Emerging Markets Stock Index Admiral (VEMAX).
Fidelity users might consider the following list of equity funds: Fidelity ZERO Large Cap Index (FNILX), Fidelity ZERO Extended Market Index (FZIPX), Fidelity Stock Selector Small Cap (FDSCX), Fidelity International Index (FSPSX) and Fidelity Emerging Markets Index (FPADX).
In summary, a broadly diversified retirement portfolio with at least 40% allocated across several U.S. and non-U.S. equity funds will produce RMD-based withdrawals that will keep pace with or exceed the rate of inflation nine years out of 10. Alternatively, if withdrawing 4% from your portfolio each year, a higher equity allocation will be required—in the range of 60% to 70% equity.
It turns out that the RMD is a built-in inflation adjuster that allows retirees to be more cautious in their asset allocation if they so choose.
We think you’d like this related webinar! Individual Investor Show: The Shocking Impacts of Inflation on Retirement
Portfolio Strategies

Retired Investor
Dispatches

MARC K from MA posted over 4 years ago:
ROBERT B from CA posted over 4 years ago:
THOMAS S from OR posted over 4 years ago:
MAHESH S from CA posted over 4 years ago:
MAHESH S from CA posted over 4 years ago:
MAHESH S from CA posted over 4 years ago:
J M from NJ posted over 4 years ago:
ROBERT A from NC posted over 4 years ago:
Peter W from AZ posted over 4 years ago:
WILLIAM S from ID posted over 4 years ago:
You need to log in as a registered AAII user before commenting.
Log InCreate an account