


Related

AAII Stock Ideas
An earnings surprise occurs when a company’s reported profits are above or below financial analysts’ expectations, which can change its share price.
by John Bajkowski | July 2022

 SMPL
SMPL
Stock prices are dictated by expectations, and prices fluctuate as these expectations are affirmed or are proven to be unfounded. The most frequently followed measure of market expectations combines analyst projections for a company’s earnings into a consensus earnings estimate.
When a company reports actual earnings that differ from the consensus estimate, the difference is regarded as unexpected earnings. More commonly it is called an earnings surprise. During the earnings reporting season, which for most companies follows the end of their fiscal quarters in March, June, September and December, financial outlets provide daily reports on earnings announcements. Firms with significant earnings surprises are often highlighted in the media.
A positive earnings surprise occurs when actual announced earnings are above the consensus estimate. Negative earnings surprises take place when announced earnings are below the earnings expectations. Stocks of firms with significant positive earnings surprises tend to show above-average price performance subsequently, while those of firms with negative surprises tend to experience below-average price performance.
To say that a company missed or exceeded its consensus estimate for the quarter does not necessarily capture the true significance of such an event. There are several ways of measuring the significance of unexpected earnings. One of them is the percentage surprise. It is calculated by subtracting the consensus estimate by the actual earnings and dividing the difference by the consensus estimate.
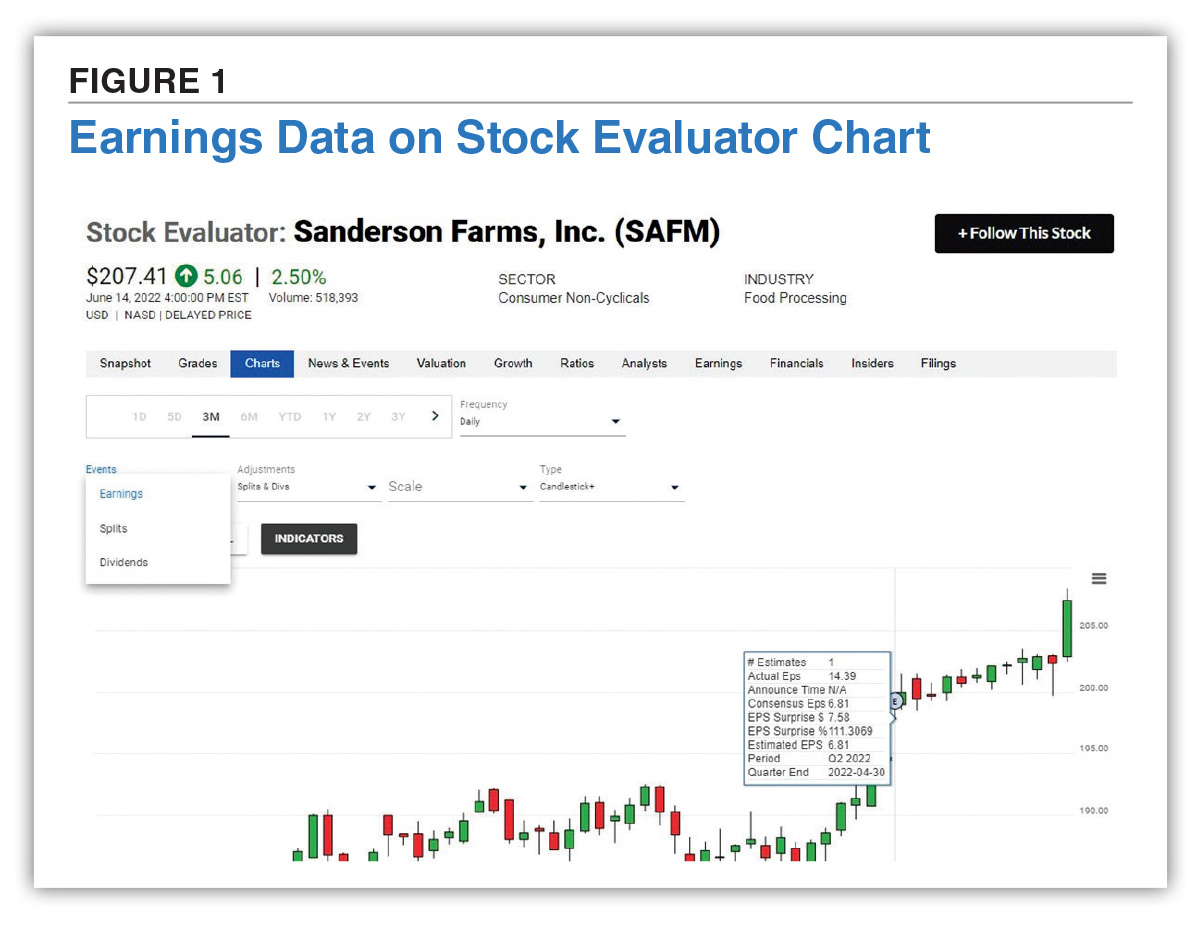
For example, food producer Sanderson Farms Inc. (SAFM) reported second-quarter 2022 earnings per share (EPS) of $14.39 on May 27, 2022. This exceeded the consensus estimate for the period of $6.81 per share. The $7.58 per share positive earnings surprise represents a 111.3% surprise.
The formula is:
= (Actual EPS – EPS estimate) ÷ EPS estimate
= ($14.39 – $6.81) ÷ $6.81
= 1.113, or 111.3%
Another method of measuring the magnitude or significance of earnings surprises is with the standardized unexpected earnings (SUE) score. SUE measures the earnings surprise in terms of its number of standard deviations above or below the consensus earnings estimate.
An earnings surprise is considered more significant the farther it is outside the statistical range of estimates expected at the time of the announcement. Assuming a normal distribution of earnings estimates, 68.3% of actual earnings will be within one standard deviation of the consensus estimate, 95.4% will be within two standard deviations, and 99.7% will be within three standard deviations.
The absolute value of SUE measures the degree of unexpected earnings. When the SUE score equals zero, there is no earnings surprise; the actual earnings per share is in line with the consensus earnings estimate.
The SUE score is calculated by subtracting the estimated earnings per share from the actual earnings per share and dividing the difference by the standard deviation of the actual earnings from the consensus estimate.
Note that SUE scores are absolute values, meaning that they will never be negative. Studies indicate that stocks with higher SUE scores tend to exhibit stronger price reactions to earnings surprises than those with low SUE scores.
Another food producer, Simply Good Foods Co. (SMPL), reported quarterly earnings per share of $0.360 on April 6, 2022, for its fiscal quarter ending on February 28. The consensus estimate was $0.274 per share. The standard deviation of the estimates determining the consensus estimate was $0.030. Therefore, the calculation is as follows:
SUE Score
= (Actual EPS – EPS estimate)
÷ standard deviation
= ($0.36 – $0.274) ÷ $0.030
= 2.9
AAII members can see earnings figures for a company’s most recent quarter on the Charts tab of the Stock Evaluator. Enter a stock ticker in the search tool at the top of any AAII.com page and select the company from the list. Click on Charts, then select Earnings from the Events option and you’ll see a circled E added to the chart on the date of the earnings announcement. Hover over the circled E to bring up the earnings surprise details. Figure 1 shows the May 27 earnings data for Sanderson Farms. AAII members also have access to five earnings estimate revision screens, which often identify stocks with earnings surprises, at the Screening section of AAII.com.
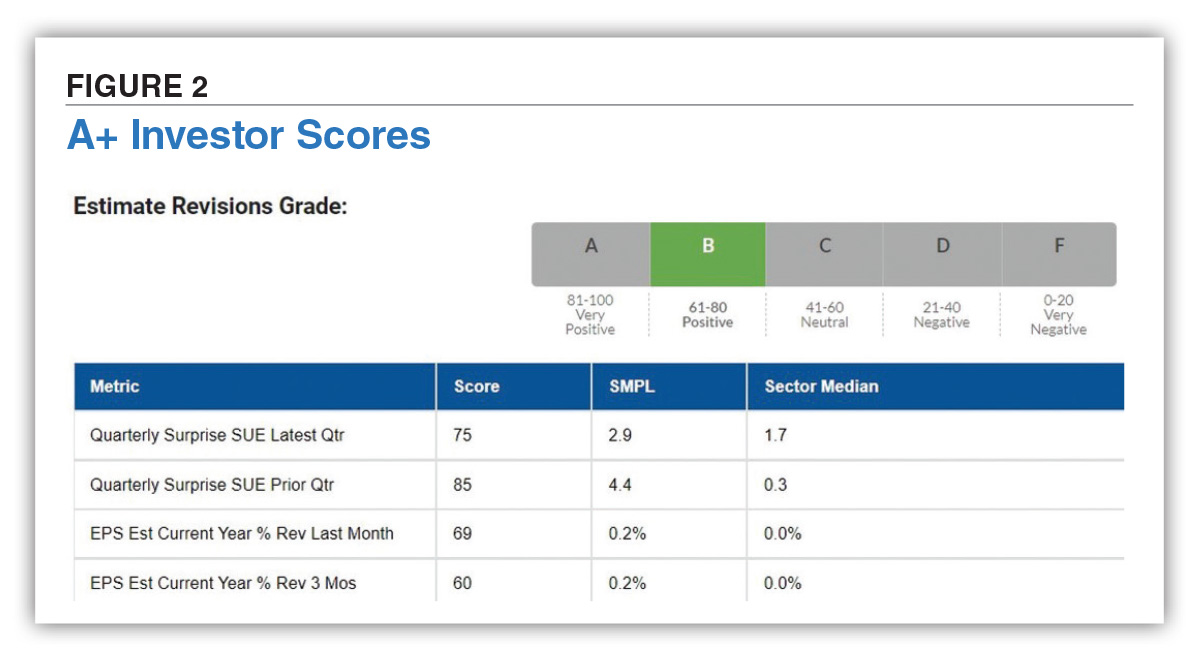
A+ Investor subscribers have access to the Grades tab, which includes an Estimate Revisions Grade. The grade is based on a score that takes into account the SUE score for the last two reported fiscal quarters as well as the change in the consensus estimate for the current fiscal year over the last month and three months. Figure 2 shows the SUE scores and percent revisions for Simply Good Foods and their resulting scores. The composite score of 72 puts Simply Good Foods in the B, or positive, grade range for estimate revisions. The Earnings tab of Stock Evaluator presents more in-depth data on actual earnings and consensus estimates over time for A+ Investors.
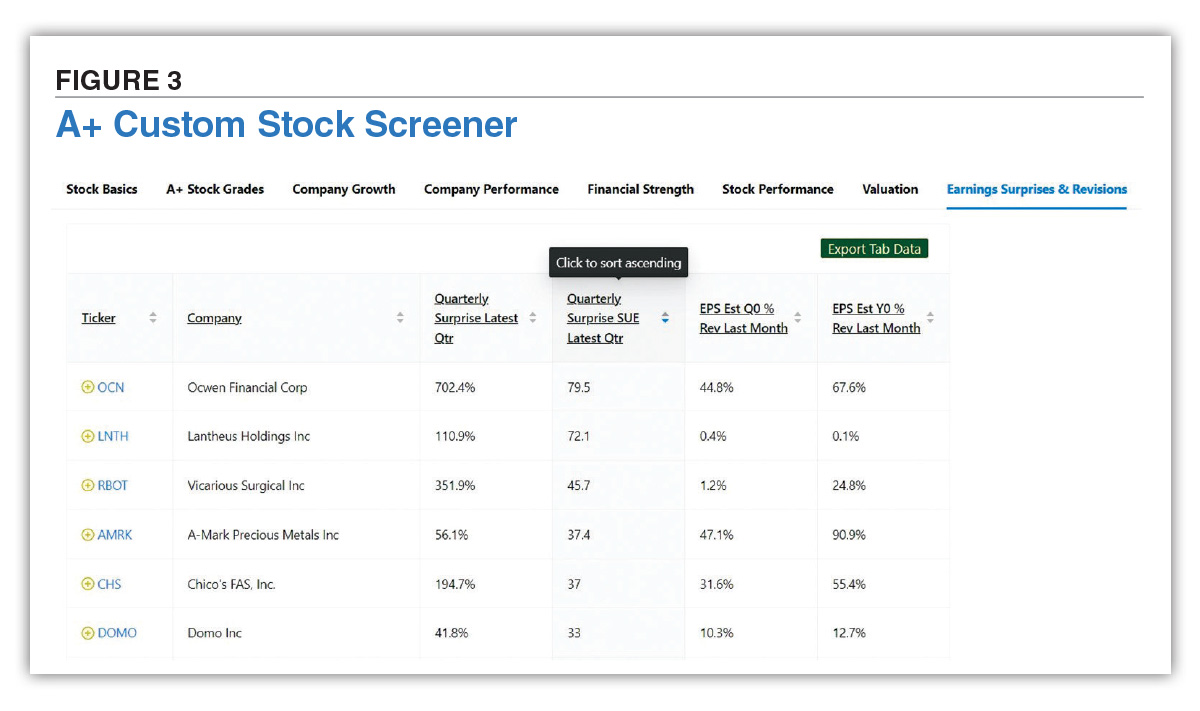
To screen on earnings revisions, A+ Investor subscribers can use the Custom Stock Screener. Filters include earnings surprise for the latest quarter, SUE for the latest quarterly earnings and estimate revision percentages for the current quarter and current year. Figure 3 shows sample results.
Changes in a stock’s price resulting from a positive or negative earnings surprise can be felt immediately, but the surprise can also have a long-term effect. While it may be difficult for individuals to buy on the initial surprise event, studies indicate that the surprise effect can persist for as long as a year after the announcement.
Therefore, it may not be prudent to buy a stock that has declined following a negative earnings surprise thinking it is now “attractively priced.” There is a good chance that the stock will continue to underperform the market for some time. Alternatively, it may not be too late to buy a stock that has seen its price jump following a positive earnings surprise.
Not surprisingly, the stock prices of larger firms tend to adjust to surprises faster than those of small firms. This is because the larger firms are tracked by more analysts and portfolio managers, who can buy and sell on news quickly.
Firms with an earnings surprise one quarter, either positive or negative, tend to have additional surprises in subsequent quarters. When a surprise signals a change in company fundamentals, management and analysts alike are typically slow to realize the strength and persistence of the change. As a result, company guidance and analyst estimates do not immediately reflect this change in fundamentals.
AAII Stock Ideas



BARRY J from TX posted over 4 years ago:
You need to log in as a registered AAII user before commenting.
Log InCreate an account