


Wayne Thorp leads a class in AAII's new Essential Investing Video Course. Go to https://www.aaii.com/ves for more information and to subscribe.
- Understand the importance of quality stocks in navigating market uncertainties for sustainable growth
- Learn about AAII’s A+ Quality Grade and its financial metrics for identifying high-quality stocks
- Discover how to access Quality Grades and incorporate them into investment strategies for long-term value
Through much of the last quarter of 2023, multiple asset classes experienced what many called an “everything rally.” Stocks, bonds and even cryptocurrency surged to end the year as the threat of inflation eased. Some analysts believe that if the troubled segments of the 2023 economy can recover in 2024, this could create a bullish scenario where the rest of the market catches up.
However, an article in The Wall Street Journal at the beginning of 2024 noted that with many major stock indexes near all-time highs, stock valuations running hot and persisting worries of an economic slowdown this year, “some investors just want the good stuff.”
What is the good stuff? Typically, that points to quality. Quality is an identified investment factor. Factor investing is the strategy of targeting securities with specific characteristics such as value, quality, momentum, size and minimum volatility. Factors are persistent and well-documented characteristics that can help investors understand differences in expected return. Factors have been, and continue to be, tools that professional investors use to seek outperformance.
The shift toward quality stocks is driven by their resilience in slower economic growth scenarios, a condition currently expected by many on Wall Street. These stocks typically feature stable financial results, minimal debt and substantial cash reserves, contributing to their historical outperformance in cooler economic periods.
Despite the optimistic outlook for U.S. economic growth, fears of a recession persist. Historical data shows that quality stocks typically outperform during bear markets and are reliable during periods of market stress, reinforcing the current investor preference for quality stocks.
While factors such as value, momentum, size and minimum volatility have almost universal definitions, the definition of quality isn’t as clear-cut. The definition of quality used by BlackRock’s iShares centers on earnings quality—specifically, stocks that are profitable, have low leverage and demonstrate stable earnings growth over time. Strong, predictable growth prospects, sustainable competitive advantages, positive cash from operations and robust balance sheets are themes running through many definitions of quality.
While the popular Magnificent Seven stocks fall into many of these categories used to define quality, there are concerns that investors might be more focused on chasing performance with these large technology stocks than selecting truly high-quality companies. Experts suggest a systematic approach to investing in quality stocks and caution that defining “quality” can be subjective. AAII’s Model Shadow Stock Portfolio incorporates the quality factor by requiring that all holdings are profitable.
A+ Investor Quality Grade
AAII has its own measure of quality for stocks in the form of the A+ Quality Grade. This metric is the percentile rank of the average of the percentile ranks of return on assets (ROA), return on invested capital (ROIC), gross profit to assets, buyback yield, change in total liabilities to assets, accruals, Z double prime bankruptcy risk (Z) score and F-Score. The score is variable, meaning it can consider all eight measures or, should any of the eight measures not be valid, the remaining measures that are valid. To be assigned a Quality Score and Grade, though, stocks must have a valid (non-null) measure and corresponding ranking for at least four of the eight quality measures.
- The eight metrics contribute to defining quality in various ways.
- Return on assets indicates how efficient a company’s management is at using its assets to generate earnings.
- Return on invested capital is a profitability measure that calculates the profit a company generates from long-term sources of company funding that have provided capital.
- Gross profit relative to total assets gives a snapshot as to whether the firm’s assets are profitable.
- Buyback yield measures the change in shares outstanding. When a company reduces the number of shares outstanding (via buybacks), shareholders’ claim to future earnings increases.
- The change in total liabilities to total assets gives an indication of whether a company’s debt has decreased relative to its assets.
- Accruals relative to total assets gives a measure of the persistence of a company’s earnings.
- The Z-Score assesses the financial riskiness of a company using four financial metrics.
- The F-Score is a discrete score comprising nine criteria to determine the strength of a firm’s financial position.
To ensure the validity of the factors used for the Quality Grade, the results of the scoring system were backtested across all letter grades (A to F) for the period of 1998 through 2019. As expected, moving from Quality Grades of F to D to C to B to A resulted in better cumulative returns for each higher grade. Even between Quality Grades of A and B, the higher letter grade outperformed the lower by more than a factor of four.
Where to Find Quality Rankings
The Quality Grade was created as part of AAII’s online investment discovery, analysis and tracking tool. It’s one of five A+ Stock Grades, which include grades for value, growth, momentum and earnings estimate revisions.
The Quality Score and Grade change less frequently than the Value or Momentum Scores and Grades because they are unaffected by price movements. Rather, the Quality Score is determined by the release of new financial data. Small changes can occur in between quarterly announcements because the score is relative. The quality metrics for a company are ranked against all companies, so as the Quality Scores are updated for other companies, it can push the Quality Score (and potentially the Quality Grade) up or down for a specific company. Again, these are typically small changes.
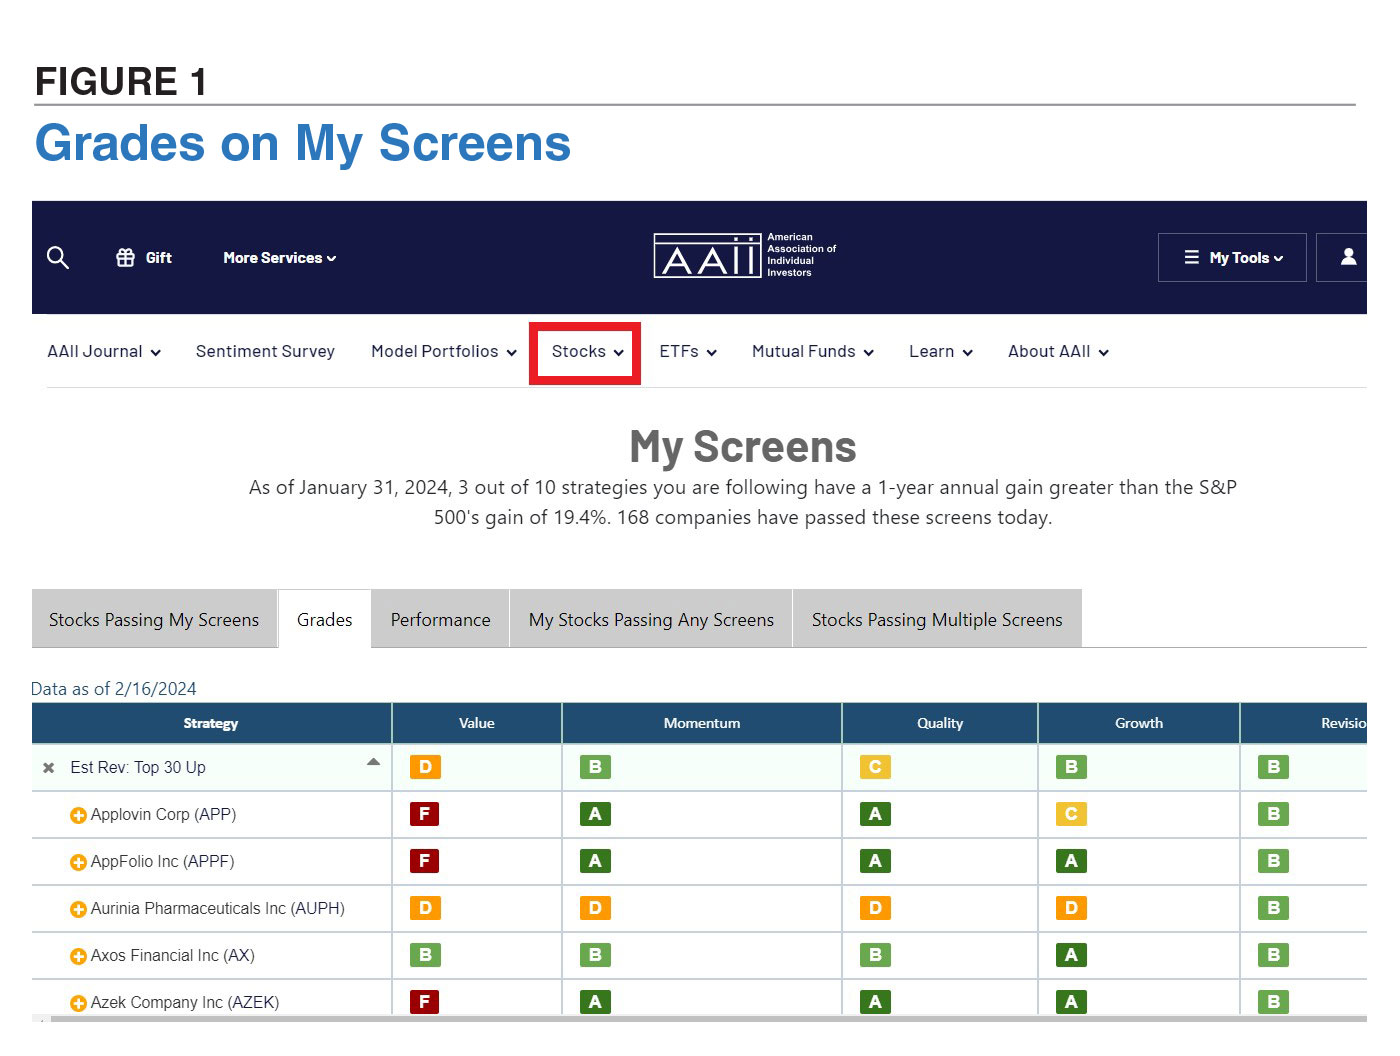
All AAII members can view Quality Grades, and the other four A+ Stock Grades, by following one or more of the AAII Stock Screens. Once you have “starred” a screen, go to the Stocks area and select My Screens. Choose the Grades tab and then click on the down arrow to the right of the screen name to see A+ Stock Grades for all the stocks that currently pass the screen (Figure 1). You can start tracking any of the stocks that interest you by clicking on the yellow plus sign to the left of the company name.
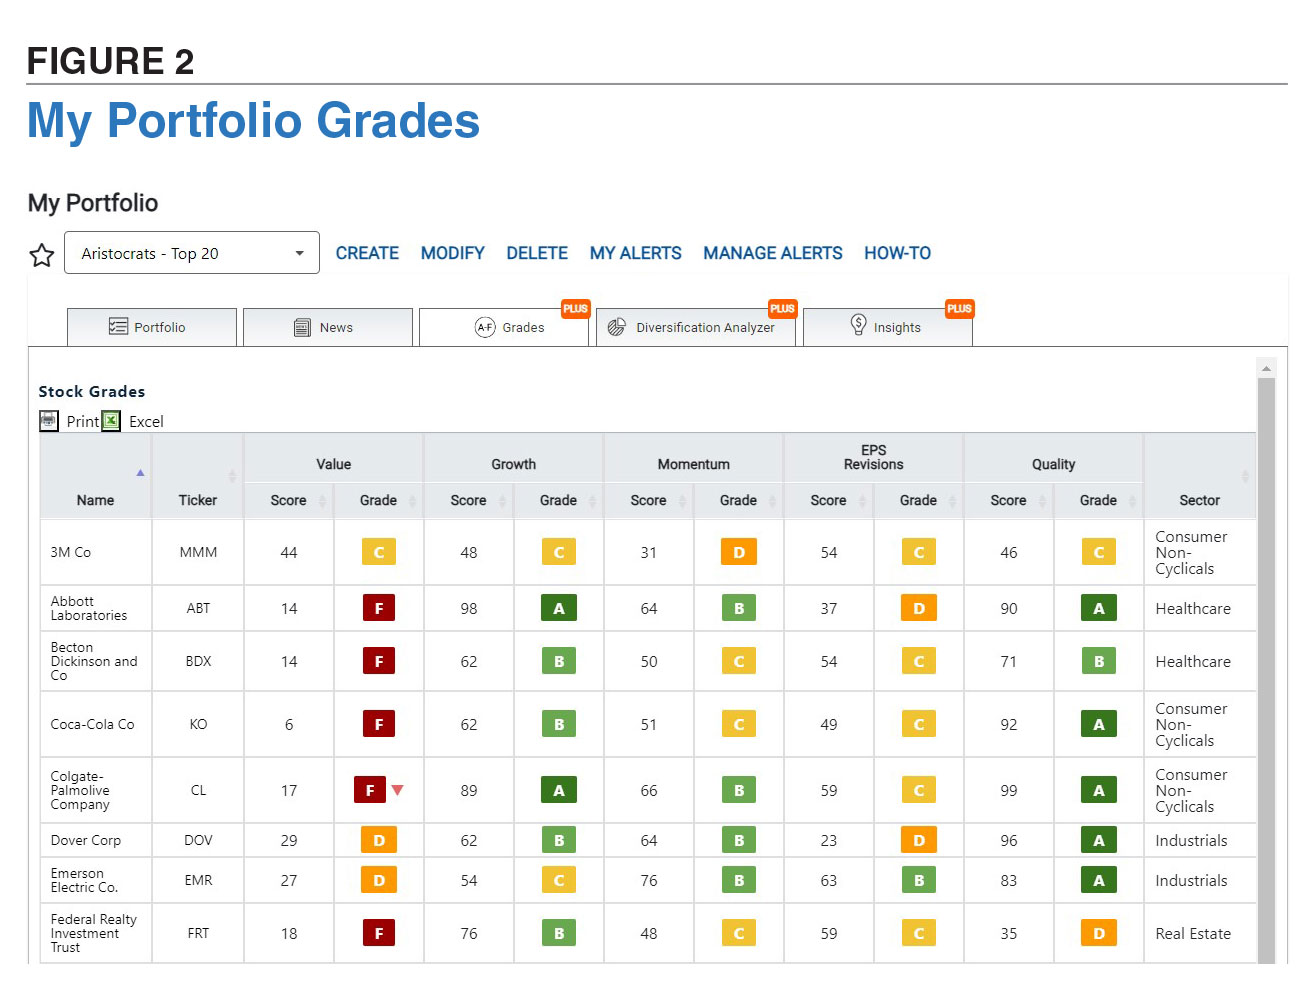
For A+ Investor and Platinum subscribers, there are several ways to view Quality Grades. You can take a deep dive into the underlying elements particular to a company’s Quality Grade via the Stock Evaluator. You can view the grades and their underlying scores for the stocks in any portfolio you create using the My Portfolio tool (Figure 2). The Quality Grade is also used to select stocks for AAII’s premium Growth Investing and VMQ Stocks model portfolios.
Conclusion
The pursuit of “quality” in stock selection and investing is more than just a trend; it’s a strategic approach grounded in robust financial metrics and prudent risk management. AAII’s A+ Quality Grade, by encompassing a comprehensive set of financial indicators, offers investors a reliable tool to identify high-quality stocks. These stocks, characterized by strong balance sheets, consistent earnings and prudent management, stand out for their resilience in challenging economic times and their potential to deliver superior returns. As investors navigate fluctuating markets and economic uncertainties, focusing on quality becomes paramount for those seeking sustainable growth and long-term value in their portfolios.
—Adapted from AAII Growth Investing commentary by Wayne A. Thorp; see https://growth.aaii.com.

Related

Stock Strategies
Myths and Truths About Quality
Discussion
FREE REPORT

Get your free copy of our special
report analyzing the tech stocks
most likely to outperform the
market.
DAVE G from TX posted over 2 years ago:
Wayne T from IL posted over 2 years ago:
BARRY J from TX posted over 2 years ago:
Wayne T from IL posted over 2 years ago:
JAMES L from TN posted over 1 year ago:
You need to log in as a registered AAII user before commenting.
Log InCreate an account